Jan 22, 2019 2018 4th quarter commentary
4th Quarter 2018 Commentary
Leonard Rickey Investment Advisors

Market Summary
After reaching all-time highs in late September, the S&P 500 fell nearly 20% in three months, including more than 7% in one week, and finished the year down for the first time since 2008. If the S&P 500 had ended the month where it closed on Christmas Eve, December would have marked the third-worst month ever for stocks, behind only October 1987 (-21.5%) and October 2008 (-16.8%)[1]. As it stands, December marked the 11th worst month and the fourth quarter marked the 8th worst quarter on the S&P 500 over the past half-century, from 1969 through 2018[2]. It’s important to note that even after the correction, the S&P 500 is back to where it was just 15 months earlier in September 2017.
The losses in U.S. stocks during the quarter were accompanied by a significant increase in volatility. In the fourth quarter, the S&P 500 closed up or down more than 1% on 28 days, compared with 36 days in the first nine months of the year and only eight days for all 2017[3]. Despite the increase in volatility, 2018 wasn’t an abnormally volatile year. It felt worse because of the low volatility in 2017, but the data show that it was below the average yearly volatility reading since 1995[4].
One of the significant factors driving markets lower was the rise in short term interest rates. The Federal Reserve raised short-term interest rates four times in 2018 from 1.5% to 2.5%. Long-term interest rates remained relatively steady during the quarter causing what is known as a “flattening yield curve.” For example, the one-year Treasury rate finished the year at 2.63% whereas the 10-year rate finished at 2.69%[5]. This flattening effect worried investors because of its strong historical record of predicting a recession. Historically, when the 1-year rate moves higher than the 10-year rate, it has preceeded the last eight recessions. There was only one false signal in the mid-sixties. Other factors contributing to the selloff were continued U.S. and China trade tensions, political uncertainty in the U.S. and abroad, and investor concerns over slowing economic growth.
While the loss on the year was “only” 4.38% on the S&P 500, diversifying asset classes didn’t provide much help. Non-U.S. equities helped accounts in the fourth quarter but performed worse than U.S. equities for the calendar year. Also, all three of alternative strategies we invest in finished down on the year. The lone bright spot was bonds. They posted positive returns in the fourth quarter as equity markets sold off. However, rising interest rates diminished returns for the full year as they finished flat. Below is a summary of returns for the major asset classes[6].

Fundamentals Remained Sound
Despite worries of an economic slowdown, the fundamental backdrop supporting growth in the U.S. economy and corporate profits remained sound. The unemployment rate stayeded near 50-year lows. Inflation remained in check and, despite an increase in short-term rates during the year, interest rates remained low by historical standards. There were pockets of weakness, particularly in housing and automobile sales, but the overall data pointed toward continued growth. The global economy continued to grow as well, with 44 of the 45 countries tracked by the Organization for Economic Cooperation and Development (OECD) on pace to expand[8]. Argentina was the only country expected to contract. While forecasts for 2019 economic growth came down during the year, they remained positive (see chart below[9]).

The corporate earnings backdrop also remained at high historic levels. Third quarter S&P 500 Index earnings rose 28% year over year, exceeding the second quarter’s 25% rate while outpacing estimates by more than 6% (See chart below[10]). Corporate profit margins reached record levels finishing the third quarter at 12.5%[11]

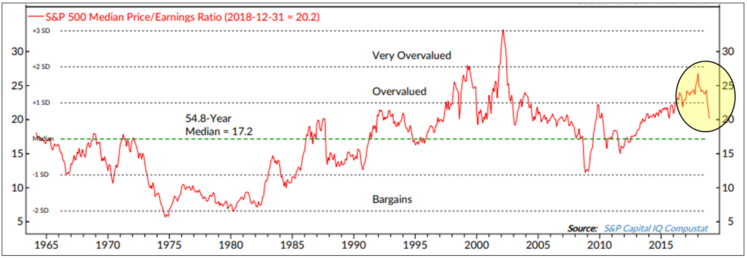
High corporate earnings combined with the decline in stock prices in 2018, reduced valuations meaningfully. Coming into the year, elevated equity valuations in the U.S. were a significant concern. At such high valuations, the long term forward return estimates had become increasingly unattractive for U.S. stocks. We see valuations as still modestly overvalued, but not nearly to the degree they were entering the year. As a result, our long term forward return estimates improved (See graph below[12]).
So Now What?
Steep market declines can be difficult to deal with. Research points out that people feel the pain of a loss twice as much as they feel the joy from an equal-sized gain[13]. Reviewing the historical data of market losses might help put the poor quarter in perspective. The following table shows each quarter the S&P 500 Index returned an equal or worse performance than the most recent quarter[14].

According to the table, most of the time, buying on the dips proved profitable. The S&P 500 fell by at least 13.5% on 21 separate quarters since 1929. There were five cases when the next quarter’s return was negative, three of which saw losses more than 10%, but there were 16 cases when the following quarter’s returns were positive. The average return in the following quarters was 12.7%. The average following 12-month return, at 22%, was more than twice the historical return of about 10%.
Of course, this doesn’t rule out a bear market occurring. Stocks are inherently risky. It’s virtually certain that you will have to live through many bear markets in stocks. Data shows we have averaged a bear market, defined as a market drop of 20% or more, about once every four years, and a decline of at least 10% about once a year[15]. If we didn’t experience down days, weeks, months, quarters, and years, there would be no reason to expect higher returns in the long run. These negative returns are one of the things the market is paying us to accept.
Many investors think they are willing to bear risk in the short term to earn a long-term return, but it is those that stay the course in the hard times who have historically earned the average over time.
The Death of Diversification Part II: Bonds
Last quarter we wrote about diversifying into non-U.S. equities and why we continue to think that is a good idea despite recent non-U.S. equity underperformance. See here: https://bestpathforward.com/the-death-of-diversification-part-1/.
This quarter we will continue our discussion on diversification and how it relates to bonds. The most well-known example of diversification is stocks and bonds. In recent years, it’s been understandably tempting to focus on holding just U.S. stocks in your portfolio. After all, the S&P 500 is up nearly four-fold from the lows it hit almost a decade ago[16]. By comparison, recent returns to bonds are uninspiring, gaining about 3% annualized over the last 10 years, and only offering average yields of around 3% today. Over the long-term, stocks have tended to deliver stronger performances than bonds. So why hold bonds at all?
Principles of diversification
Before we make a case for investing in bonds, let’s refresh the general concept of diversification. The most commonly cited benefit of diversification is the reduction of portfolio volatility. In a diversified portfolio, assets don’t all move in sync with each other. So, when one holding is going down, another may be going up. How and when investments move about one another is known as correlation. When assets move in the same direction at the same time, they are highly correlated. When one asset tends to move up when the another goes down, the two assets are negatively correlated.
Diversification is commonly referred to as the only “free lunch” in investing. Combining assets that move in different directions into a portfolio helps reduce the overall volatility of that portfolio. This volatility reduction constitutes the “free lunch” but does not alter returns. The data below is from stocks, as represented by the S&P 500 Index and bonds, as represented by the Bloomberg Barclays Aggregate Bond Index. As of 12/31/2018, the S&P 500 has had a 13.68% annualized 10-year return whereas bonds have had a 3.48% return. Stocks are much riskier than bonds and you can see that in the data below. Standard deviation or volatility is a common way to measure risk. Stocks have had a 13.61% standard deviation compared to a much lower 2.84% standard deviation for bonds. The average correlation between the two asset classes was -.06 over the last 10 years. Here are the numbers[17]:

The table on the left shows the individual risk and return of stocks and bonds over the last 10 years. The table on the right shows a 50/50 portfolio of stocks and bonds. If you invested in a portfolio of 50% stocks and 50% bonds you get the weighted average of the return (13.12*.5) + (3.48%*.5) = 8.3%. Instead of getting the weighted average of the standard deviation (13.61*.5) + (2.84*.5) = 8.23%, the portfolio’s actual standard deviation is 6.87%. Because the two assets are not correlated, the risk of the portfolio is reduced by more than the sum of the parts, nearly 20% in this case.
However, this volatility reducing principle holds only if the correlation between asset classes is low. For example, if we use the same numbers as above, but change the correlation to .8 it makes a significant difference in the portfolio’s risk

(highlighted in yellow). The portfolio volatility increases from 6.87% to 7.99% just because we changed the correlation of the two asset classes from -.06 to .8.
This principle of low correlation is powerful. It allows investors to keep more of their money invested in higher-risk assets, with higher expected returns, while lowering the overall risk of the portfolio. Even if we add an asset that has higher volatility than stocks, we can bring down the overall portfolio volatility. Below is another example but instead of adding a lower volatility asset, like bonds, we’ve added a higher volatility asset. The total portfolio volatility (highlighted in yellow) is lower than either of the two individual holdings because of the low correlation.

Another way of illustrating this point is to examine the 14 largest global stock markets in the MSCI All-Cap World Index (ACWI)[18]. In the below chart, we see that the average of individual market volatilities is 26.4% (red bar). If we were to combine each market into equal weights in a portfolio the volatility of the portfolio would decrease to 19.8% (green bar)[19]. This decrease is due to the correlation between each of the stock markets is relatively modest at .6.

The case for bonds
The central advantage of diversification is that it allows investors to hold many risky assets while maintaining a tolerable level of portfolio risk. However, many investors express confusion about how two investments can both be expected to rise in value, even while they are uncorrelated. After all, if they are uncorrelated, shouldn’t we expect them to move in different directions? Bonds and stocks offer some perspective on this apparent contradiction. The returns accumulated from both stocks and bonds are rising over time. But they are rising at different times. As a result, the investor can smooth out return streams across different periods of time.
Because bonds are negatively correlated to stocks, combining them in a portfolio with stocks smooths out the total portfolio’s returns and can make it much easier for an investor to stay disciplined. Below is a comparison of returns over different periods using the S&P 500 and then using a portfolio consisting of 60% S&P 500/40% 5-year Treasuries[20]. Adding bonds to an all-stock portfolio limits the number of times you experience negative returns.

Bonds can help us control the level of risk in our portfolios in another way. They are less risky than stocks. Stocks generally rise during a growing economy and bonds can hold value when stocks decline. Stocks are riskier than bonds so we expect them to have higher long-term returns. Stocks are also prone to sharp sell-offs. We witnessed this last quarter where stocks dropped 20% or more in three months. Bonds may not bring in the returns that you can get from stocks, but that’s not their job. Their job is to help you sleep soundly at night.
Correlations are not static, so bonds do not guarantee protection when stocks fall. Most of the time they have done a reasonable job of protecting investors during stock market selloffs. For example, since 2008, the S&P 500 has corrected 14 times by an average of 13.9%[21]. In every single correction, bonds have outperformed.

Another important function of bonds is that they can act as a source of funds for either rebalancing into stocks at lower levels or for spending purposes for cash flow needs. The majority of stock market corrections have been accompanied by gains in bonds. When this happens, we can sell what has gone up in price (i.e. bonds) and buy more of what has gone down in price (i.e. stocks). Without bonds in the portfolio, we wouldn’t have the opportunity to buy shares at lower prices.
If you are spending from your portfolio and stocks correct, we don’t have to sell stocks at lower prices for spending purposes. We can sell bonds and wait for stocks to rebound before selling them. There is no guarantee that the shares will appreciate and investors may lose money in stocks. If a recovery occurs, you will hold more shares than you originally started with. You would have bought more shares on sale.
Summary
Diversification is hard and is not meant to prevent declines. It is tempting to pile into what has done the best recently. A diversified portfolio may underperform a broad market index for a very long time (like we’ve seen the past 10 years with U.S. equity indexes). If some part of your portfolio isn’t performing poorly, you are probably not diversified.
As always, please call if you have any questions or would like to discuss your account in more detail.
[21] LPL Research, using Bloomberg data. As of 11/23/18
[20] A Wealth of Common Sense, “Diversification is (Almost) Undefeated”
[18] The ACWI is constructed to represent over 99% of total global equity market capitalization, and the 14 markets illustrated represent over 75%.
[19] Annualized volatility 1991-2017. Resolve Asset Management, “Skis and Bikes: The Untold Story of Diversification”.
[16] Yahoo! Finance
[17] Data from Morningstar Direct, calculations done by Leonard Rickey Investment Advisors
[15] Capital Group. Using the Dow Jones Industrial Average from 1900-2017.
[13] (Tversky & Kahneman, 1986)
[14] ETF.com. “Historical Data Can Comfort”, Larry Swedroe. Data from Bloomberg. Total returns include reinvestment of dividends.
[12] Ned Davis Research. S&P 500 Median Price/Earnings Ratio represents the median P/E of the 500 stocks in the S&P 500. Earnings are based on 12-month trailing figures
[10] LPL Financial Research, Thomson Reuters data.
[11] Yardeni Research using operating profit margins.
[1] LPL Research
[2] LPL Research, ETF.com “Historical Data Can Comfort”
[3] Morningstar
[4] Alvarezquanttrading.com, “How Bad was 2018’s Volatility?”. Data from 1995-2018
[5] U.S. Department of the Treasury
[6] Data from Morningstar Direct, as of 12/31/2018
[7] Alternatives benchmark includes 50% SG Trend Index, 25% Swiss Re Global Cat Bond TR Index and 25% CBOE Eurekahedge Short Volatility Hedge Fund Index
[8] Dimensional Fund Advisors
[9] LPL Financial Research, Organization for Economic Cooperation and Development (OECD)
IMPORTANT DISCLOSURES
Leonard Rickey Investment Advisors, PLLC (“LRIA”), is an SEC registered investment adviser located in the State of Washington. Registration does not imply a certain level of skill or training. For information pertaining to the registration status of LRIA, please contact LRIA or refer to the Investment Adviser Public Disclosure website (www.adviserinfo.sec.gov).
This newsletter is provided for general information only and contains information that is not suitable for everyone. As such, nothing herein should be construed as the provision of specific investment advice or recommendations for any individual. To determine which investments may be appropriate for you, consult your financial advisor prior to investing. All performance referenced herein is historical in nature and is not an indication of or a guarantee of future results. All indices are unmanaged and cannot be invested into directly. Unmanaged index returns do not reflect fees, expenses, or sales charges. Index performance is not indicative of the performance of any investment.
Your experience may vary according to your individual circumstances and there can be no assurance that LRIA will be able to achieve similar results for all clients in comparable situations or that any particular strategy or investment will prove profitable. As investment returns, inflation, taxes and other economic conditions vary, your actual results may vary significantly. The economic forecasts set forth in the presentation may not develop as predicted and there can be no guarantee that strategies promoted will be successful. There is no guarantee that the views and opinions expressed herein will come to pass. This newsletter contains information derived from third party sources. Although we believe these third party sources to be reliable, we make no representations as to the accuracy or completeness of any information prepared by any unaffiliated third party incorporated herein, and take no responsibility therefore.
Stock investing includes numerous specific risks including the fluctuations of dividend, loss of principal, and potential illiquidity of the investment in a falling market. International and emerging markets investing involves special risks such as currency fluctuation and political instability and may not be suitable for all investors. Small cap stocks may be subject to a higher degree of risk than more established companies’ securities. The illiquidity of the small cap market may adversely affect the value of these investments. Information presented herein is subject to change without notice and should not be considered as a solicitation to buy or sell any security. This newsletter should not be regarded as a complete analysis of the subjects discussed. Bonds are subject to market and interest rate risk if sold prior to maturity. Bond values and yields will decline as interest rates rise and bonds are subject to availability and change in price. The risks associated with investment-grade corporate bonds are considered significantly higher than those associated with first-class government bonds. The difference between rates for first-class government bonds and investment-grade bonds is called investment-grade spread. The range of this spread is an indicator of the market’s belief in the stability of the economy. The fast price swings in commodities and currencies can result in significant volatility in an investor’s holdings. There is no assurance that the techniques and strategies discussed are suitable for all investors or will yield positive outcomes. The Value investments can perform differently from the market as a whole. They can remain undervalued by the market for long periods of time.
Any projections, forecasts and estimates, including without limitation any statement using “expect” or “believe” or any variation of either term or a similar term, contained here are forward-looking statements and are based upon certain current assumptions, beliefs and expectations that LRIA considers reasonable or that the applicable third parties have identified as such. Forward-looking statements are necessarily speculative in nature, and it can be expected that some or all of the assumptions or beliefs underlying the forward-looking statements will not materialize or will vary significantly from actual results or outcomes. Some important factors that could cause actual results or outcomes to differ materially from those in any forward-looking statements include, among others, changes in interest rates and general economic conditions in the U.S. and globally, changes in the liquidity available in the market, change and volatility in the value of the U.S. dollar, market volatility and distressed credit markets, and other market, financial or legal uncertainties. Consequently, the inclusion of forward-looking statements herein should not be regarded as a representation by LRIA or any other person or entity of the outcomes or results that will be achieved by following any recommendations contained herein. While the forward-looking statements here reflect estimates, expectations and beliefs, they are not guarantees of future performance or outcomes. LRIA has no obligation to update or otherwise revise any forward-looking statements, including any revisions to reflect changes in economic conditions or other circumstances arising after the date hereof or to reflect the occurrence of events (whether anticipated or unanticipated), even if the underlying assumptions do not come to fruition. Opinions expressed herein are subject to change without notice and do not necessarily take into account the particular investment objectives, financial situations, or particular needs of all investors. For additional information about LRIA, including fees and services, please contact us for our Form ADV disclosure brochure using our contact information herein. Please read the disclosure brochure carefully before you invest or send money.
INDEX DEFINITIONS
The Barclays Aggregate Bond Index represents securities that are SEC-registered, taxable, and dollar denominated. The index covers the U.S. investment-grade fixed rate bond market, with index components for government and corporate securities, mortgage pass-through securities, and asset-backed securities.
The Standard & Poor’s 500 Index is a capitalization-weighted index of 500 stocks designed to measure performance of the broad domestic economy through changes in the aggregate market value of 500 stocks representing all major industries. It cannot be invested into directly.
The Russell 2000 Index is an unmanaged index generally representative of the 2,000 smallest companies in the Russell Index, which represents approximately 10% of the total market capitalization of the Russell 3000 Index.
The MSCI Emerging Markets Index is a float-adjusted market capitalization index that consists of indices of approximately 800 stocks and is designed to measure equity market performance in 23 emerging economies: Brazil, Chile, China, Colombia, Czech Republic, Egypt, Greece, Hungary, India, Indonesia, Korea, Malaysia, Mexico, , Peru, Philippines, Poland, Qatar, Russia, South Africa, Taiwan, Thailand, Turkey, and the United Arab Emirates.
The MSCI EAFE (Europe, Australasia, Far East) Index is a free float-adjusted market capitalization index of approximately 900 stocks and is designed to measure equity market performance in 21 developed market countries outside of North America.
The Dow Jones Industrial Average is an unmanaged, price-weighted average of 30 actively traded industrial and service-oriented blue-chip stocks.
Company News
Market Commentary
Retirement Planning
Tax Planning
Cyber Security
Important Disclosures
Leonard Rickey Investment Advisors, PLLC (“LRIA”), is an SEC registered investment adviser located in the State of Washington. Registration does not imply a certain level of skill or training. For information pertaining to the registration status of LRIA, please contact LRIA or refer to the Investment Adviser Public Disclosure website (www.adviserinfo.sec.gov).
This is provided for general information only and contains information that is not suitable for everyone. As such, nothing herein should be construed as the provision of specific investment advice or recommendations for any individual. To determine which investments may be appropriate for you, consult your financial advisor prior to investing. There is no guarantee that the views and opinions expressed herein will come to pass. This newsletter contains information derived from third party sources. Although we believe these third-party sources to be reliable, we make no representations as to the accuracy or completeness of any information prepared by any unaffiliated third party incorporated herein and take no responsibility therefore.
Any projections, forecasts and estimates, including without limitation any statement using “expect” or “believe” or any variation of either term or a similar term, contained here are forward-looking statements and are based upon certain current assumptions, beliefs and expectations that LRIA considers reasonable or that the applicable third parties have identified as such. Forward-looking statements are necessarily speculative in nature, and it can be expected that some or all of the assumptions or beliefs underlying the forward-looking statements will not materialize or will vary significantly from actual results or outcomes. Some important factors that could cause actual results or outcomes to differ materially from those in any forward-looking statements include, among others, changes in interest rates and general economic conditions in the U.S. and globally, changes in the liquidity available in the market, change and volatility in the value of the U.S. dollar, market volatility and distressed credit markets, and other market, financial or legal uncertainties. Consequently, the inclusion of forward-looking statements herein should not be regarded as a representation by LRIA or any other person or entity of the outcomes or results that will be achieved by following any recommendations contained herein. While the forward-looking statements here reflect estimates, expectations and beliefs, they are not guarantees of future performance or outcomes. LRIA has no obligation to update or otherwise revise any forward-looking statements, including any revisions to reflect changes in economic conditions or other circumstances arising after the date hereof or to reflect the occurrence of events (whether anticipated or unanticipated), even if the underlying assumptions do not come to fruition. Opinions expressed herein are subject to change without notice and do not necessarily take into account the particular investment objectives, financial situations, or particular needs of all investors.
For additional information about LRIA, including fees and services, please contact us for our Form ADV disclosure brochure using our contact information herein. Please read the disclosure brochure carefully before you invest or send money.
2026 1st Quarter Investment Commentary