Jul 14, 2023 2023 2nd Quarter Investment Commentary
- The S&P 500 broke out of its yearlong trading range, producing positive returns for the third quarter in a row. Excitement around artificial intelligence propelled growth stocks to outsized gains.
- Economic data came in better than expected as growth continued to be resilient, and inflation continued to moderate.
- Our technical indicators were positive while our economic indicators were showing warning signs which left us neutral on stocks versus bonds.
Market Summary
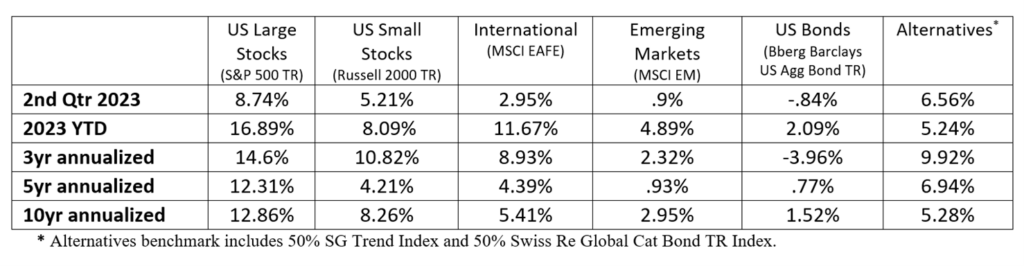
Stocks advanced for the third quarter in a row after reaching their bear market lows in October 2022. Many investors’ worries failed to materialize as inflation continued to moderate, a debt ceiling agreement was reached, and the US economy continued to surprise to the upside. In addition, corporate earnings came in better than expected, reflecting stronger-than-expected sales and increasing profit margins. As measured by the S&P 500 TR index, US stocks returned 8.7% in the second quarter to bring its first-half gain to 16.9%.
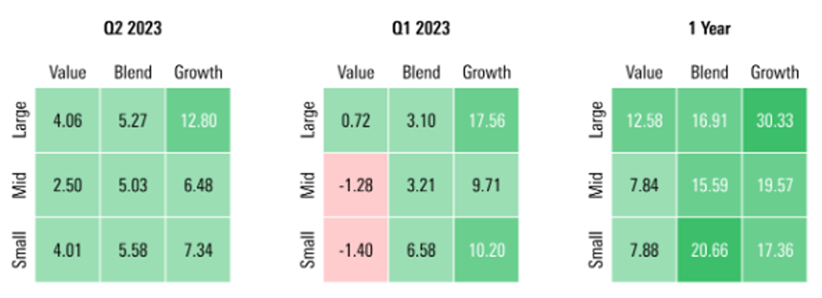
The performance of major benchmarks varied significantly, with the excitement around artificial intelligence driving growth stocks to outsized gains relative to other areas of the market. Most asset classes produced solid returns, but US growth stocks strong performance made it difficult for other market areas to keep up. The growth-heavy Nasdaq Composite Index rose over 13% for the quarter and over 32% during the first half, it’s best first half since 1983. More defensive areas of the market lagged but still produced positive returns. Of the major risk asset classes we follow, only commodities, gold and bonds were down.
The Federal Reserve remained committed to reducing inflation, indicating that it will hike interest rates at least once more, bringing interest rates to their highest levels in more than two decades. The most credit-sensitive sectors of the bond market outperformed during the second quarter, while the most interest rate-sensitive sectors lagged, most notably US Treasuries. Below is a summary of the benchmark returns. (1)
Economic Review
On the one hand, the Conference Board’s Leading Economic Index contracted for the 14th straight month and was at a level consistent with prior recessions. On the other hand, coincident indicators like income and employment data continued to come in strong and suggested a recession was not here yet.
Higher interest rates created some slowdown in more interest rate-sensitive areas of the economy, like the housing market, but it appeared it would take more time for the higher rates to flow through to the general economy. Most households have refinanced their mortgage at extremely low-interest rates. Additionally, businesses took advantage of the low-rate environment of years prior and refinanced much of their debt at low rates. This dynamic likely means that the economy is less interest rate sensitive than in prior cycles, keeping the economy stronger for longer. Our base case is a slowing but still resilient economy in the near term, with recession risks pushed out to 2024.
The US economy grew at a 2.0% annualized rate in the first quarter, larger than the previous estimate of 1.3% (2). The continued strength in the labor market was a key driver of that growth. Employers have added over 300,000 jobs per month in 2023, and the US unemployment rate remained near an all-time low of 3.7%. In addition, there were still 1.6 job openings for every one unemployed person (3). Inflation continued to decrease due to lower energy, homes, and durable goods prices. This, along with rising wages, left consumer spending in good shape.
The economy appeared to be in a sweet spot of moderating inflation and resilient economic growth that could last longer. The inflation picture looks more challenging after the next few quarters. Tight labor markets kept sticky inflation categories, like wages, elevated (4). The Fed’s target of 2% inflation may be difficult to achieve, particularly without a recession. The Federal Reserve has never lowered inflation by 4% or more without triggering a recession, and there has never been a spike in inflation above 5% that didn’t result in a recession. Even with a recession, inflation may come back quickly and is a risk for the longer-term outlook. This dynamic left the Federal Reserve with the difficult challenge of bringing inflation back near its target without prompting a recession.
Market Review
Investors came into the year extremely pessimistic. Stocks and bonds were coming off negative returns in 2022, inflation was over 6%, and many investors were anticipating a recession. For the first time since Bloomberg began tracking Wall Street strategist forecasts in 1999, their expectation was for negative stock market returns. Investors were caught off guard with the strong rally and by the end of the quarter, extreme investor pessimism reversed to optimism, though it was not yet at extreme levels.
With the strong rally, the S&P 500 broke out of its yearlong trading range, suggesting further upside potential. In fact, following 10%+ gains in the first six months, the S&P 500 has risen 75% of the time by a median of 9.7% in the second six months. Declines have occurred only after exceptionally large gains. In the four cases when the S&P 500 soared over 20% in the first half (1929, 1943, 1975, and 1987), it declined every time in the second half by a median of 6.5% (5).
Despite the breakout, market breadth remained a concern. Mega-cap tech stocks accounted for the lion’s share of positive market performance. These stocks, including Apple, Microsoft, Alphabet, Amazon, NVIDIA, Tesla and Meta, rose sharply during the quarter due to the excitement over artificial intelligence.
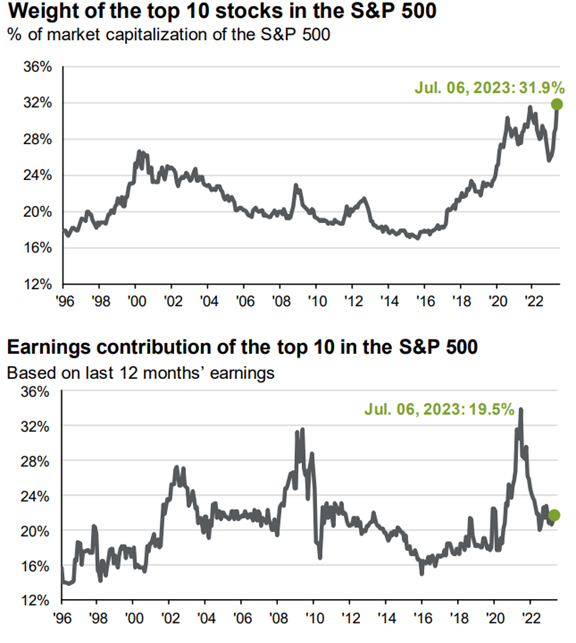
The narrow rally resulted in two issues for the US market: valuations and concentration. First, by quarter end, the seven companies listed above had a collective weighting in the S&P 500 larger than six entire sectors combined (6). The weight of the top 10 stocks in the S&P 500 was 31%, a record concentration dating back at least three decades. However, the earnings contribution to the index of those top 10 stocks was just 19.5% (7). In 2021, the weight and earnings contributions were essentially commensurate, but these names were no longer pulling their weight in terms of profits.
In addition, the overall valuation of the S&P 500 looked high. The top ten stocks were 45% more expensive than their long-term average, compared to the rest of the S&P 500, which was just 13% more expensive compared to its long-term average (8). From a valuation perspective, international markets and small/mid cap markets were more attractive.
Portfolio Positioning
The stock market declines in 2022 were pricing in a mild recession, but the economy proved more resilient than expected. By the end of the quarter, markets were pricing in a “soft landing” scenario of continued economic growth, lower inflation, and lower interest rates. Given the uncertain landscape, we aren’t positioning portfolios for any specific outcome but believe staying diversified to several potential scenarios is essential.
We retained a neutral stance toward equities during the quarter. Technical indicators continued to be positive, suggesting stocks can continue to rally in the second half. If the economy continues to perform well and inflation continues to moderate, we can see a continued grind higher. On the other hand, negative leading economic indicators coupled with high US valuations and restrictive interest rates point toward higher recession risks than normal. Although the likelihood of an immediate recession is not high, any downside surprise could lead to volatility.
We see risks in the mega-cap tech area of the market that has done so well year to date. We are underweight technology and are positioned for the rally to broaden out into value stocks and smaller cap stocks that haven’t seen as much upside as the large-cap indices.
In fixed income, we shortened our duration further by adding a money market fund to portfolios. We maintain the opinion that the market has had it wrong on Fed policy in its expectations of rate cuts. While the expectations for a cut faded during the quarter, we still think the market is overly ambitious in its expectations for rate cuts. We see risks of higher interest rates and stickier inflation and have kept maturities short as a result. Money market funds earn nearly 5% and have little price risk if interest rates increase. This return is a high hurdle to clear when looking to buy more risky bonds.
Performance Review
Equities
US equities drove the bulk of performance during the quarter. Technology, Communication Services, and Consumer Discretionary were the top performing sectors. We were generally underweight in two of the three (Technology and Consumer Discretionary) and overweight value sectors like Energy, Financials, Materials, and Healthcare that underperformed. Allocations to non-U.S. funds helped performance, though this was driven by fund selection.
Fixed Income
Our fixed-income positions were helped due to the shorter duration. In particular, we were generally overweight short-term bonds and money market funds.
Alternatives
On balance, alternative positions contributed to performance during the quarter. Positions in the re-insurance market helped, while small positions in gold were a detractor. Both continued providing good sources of uncorrelated returns over extended time frames.
Not all portfolios are identical. We manage accounts that have additional complexities not discussed in this update. Some of the statements are forward-looking but do not guarantee future performance. Please reach out to your advisor with any questions.
Sources:
- Morningstar Direct, as of 6/30/2023
- Bureau of Economic Analysis, as measured by real GDP growth.
- Federal Reserve Economic Data, as of 5/21/23
- Annual average hourly earnings were 4.4% in June per the US Bureau of Labor Statistics
- Ned Davis Research
- 27.7% versus 26.8% in Real Estate, Materials, Utilities, Energy, Consumer Staples and Communication Services.
- JPMorgan, Guide to the Markets Q2 2023
- JPMorgan, Guide to the Markets Q2 2023
INDEX DEFINITIONS
The Barclays Aggregate Bond Index represents securities that are SEC-registered, taxable, and dollar denominated. The index covers the US investment-grade fixed rate bond market, with index components for government and corporate securities, mortgage pass-through securities, and asset-backed securities.
The Standard & Poor’s 500 Index is a capitalization-weighted index of 500 stocks designed to measure performance of the broad domestic economy through changes in the aggregate market value of 500 stocks representing all major industries. It cannot be invested into directly.
The Russell 2000 Index is an unmanaged index generally representative of the 2,000 smallest companies in the Russell Index, which represents approximately 10% of the total market capitalization of the Russell 3000 Index.
The MSCI Emerging Markets Index is a float-adjusted market capitalization index that consists of indices of approximately 800 stocks and is designed to measure equity market performance in 23 emerging economies: Brazil, Chile, China, Colombia, Czech Republic, Egypt, Greece, Hungary, India, Indonesia, Korea, Malaysia, Mexico, , Peru, Philippines, Poland, Qatar, Russia, South Africa, Taiwan, Thailand, Turkey, and the United Arab Emirates.
The MSCI EAFE (Europe, Australasia, Far East) Index is a free float-adjusted market capitalization index of approximately 900 stocks and is designed to measure equity market performance in 21 developed market countries outside of North America.
The SG Trend Index is a subset of the SG CTA Index and follows traders of trend following methodologies. The SG CTA Index is equal weighted, calculates the daily rate of return for a pool of CTAs selected from the larger managers that are open to new investment.
Swiss Re Global Cat Bond Index tracks the aggregate performance of all catastrophe bonds issued offered under Rule 144A. The index captures bonds denominated in any currency, all rated and unrated cat bonds, outstanding perils, and triggers. The index is not exposed to currency risk from non-USD denominated cat bonds.
The Nasdaq Composite Index is a market capitalization-weighted index of more than 3,000 stocks listed on the Nasdaq stock exchange.
Company News
Market Commentary
Retirement Planning
Tax Planning
Cyber Security
Important Disclosures
Leonard Rickey Investment Advisors, PLLC (“LRIA”), is an SEC registered investment adviser located in the State of Washington. Registration does not imply a certain level of skill or training. For information pertaining to the registration status of LRIA, please contact LRIA or refer to the Investment Adviser Public Disclosure website (www.adviserinfo.sec.gov).
This is provided for general information only and contains information that is not suitable for everyone. As such, nothing herein should be construed as the provision of specific investment advice or recommendations for any individual. To determine which investments may be appropriate for you, consult your financial advisor prior to investing. There is no guarantee that the views and opinions expressed herein will come to pass. This newsletter contains information derived from third party sources. Although we believe these third-party sources to be reliable, we make no representations as to the accuracy or completeness of any information prepared by any unaffiliated third party incorporated herein and take no responsibility therefore.
Any projections, forecasts and estimates, including without limitation any statement using “expect” or “believe” or any variation of either term or a similar term, contained here are forward-looking statements and are based upon certain current assumptions, beliefs and expectations that LRIA considers reasonable or that the applicable third parties have identified as such. Forward-looking statements are necessarily speculative in nature, and it can be expected that some or all of the assumptions or beliefs underlying the forward-looking statements will not materialize or will vary significantly from actual results or outcomes. Some important factors that could cause actual results or outcomes to differ materially from those in any forward-looking statements include, among others, changes in interest rates and general economic conditions in the U.S. and globally, changes in the liquidity available in the market, change and volatility in the value of the U.S. dollar, market volatility and distressed credit markets, and other market, financial or legal uncertainties. Consequently, the inclusion of forward-looking statements herein should not be regarded as a representation by LRIA or any other person or entity of the outcomes or results that will be achieved by following any recommendations contained herein. While the forward-looking statements here reflect estimates, expectations and beliefs, they are not guarantees of future performance or outcomes. LRIA has no obligation to update or otherwise revise any forward-looking statements, including any revisions to reflect changes in economic conditions or other circumstances arising after the date hereof or to reflect the occurrence of events (whether anticipated or unanticipated), even if the underlying assumptions do not come to fruition. Opinions expressed herein are subject to change without notice and do not necessarily take into account the particular investment objectives, financial situations, or particular needs of all investors.
For additional information about LRIA, including fees and services, please contact us for our Form ADV disclosure brochure using our contact information herein. Please read the disclosure brochure carefully before you invest or send money.
2026 1st Quarter Investment Commentary