Oct 17, 2023 2023 3rd Quarter Investment Commentary
- After a strong first half, stocks, as measured by the S&P 500 TR, pulled back during a historically weak third quarter.
- Economic data continued to be stronger than expected and even showed signs of accelerating. This, amongst other factors, caused long term bond yields to increase significantly during the quarter.
- We ended the quarter with signs of excessive pessimism and oversold conditions, and are viewing the pullback as an opportunity to increase equity positions into year end.
Market Summary
After a strong start to the year, stocks, as measured by the S&P 500 TR, fell during the quarter. The S&P 500 TR, up nearly 20% through July, corrected 7% in August and September, mainly due to higher long-term bond yields. The higher bond yields spooked equity investors despite strong second-quarter earnings, continued strength in the labor market, and moderating inflation.
Recession risks have been elevated for over a year, but economic data continued to come in stronger than expected. The solid economic data kept the Federal Reserve from cutting rates as many investors were hoping for. Instead, The Fed indicated that they would keep interest rates higher for longer, pushing the 10-year Treasury note significantly higher during the quarter from 3.84% to 4.57%.
In the US, all size and style indices declined for the quarter and all sectors declined except energy and communication services. Large-cap stocks outperformed small-caps, while value areas generally outperformed growth areas. Defensive sectors like Utilities, Real Estate, and Consumer Staples performed the worst. They came under increased selling pressure as rising risk-free rates made their high dividend yields less appealing to more defensive investors.
This monetary tightening cycle has been the steepest and fastest over the past 40 years, but it appeared closer to the end than the beginning. The sell-off in long-term bonds brought down the overall bond market, but short-term bonds, corporate bonds, and money market funds held up relatively better. Despite offering its highest yields in over 15 years, the overall bond market was on track for its third straight year of losses.
In a traditional recessionary environment, Treasury bonds typically outperform corporate bonds. We didn’t see that in the quarter. Instead, we saw the opposite, which could signal that investors expected the economy to remain strong. Below is a summary of the benchmark returns (1).
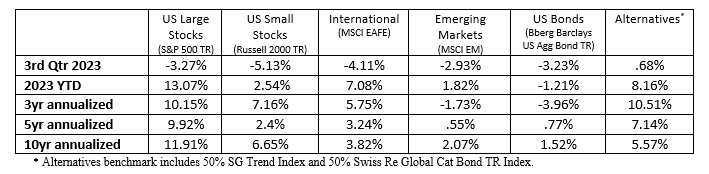
Market Review
Historically, the third quarter is the worst quarter for stocks. This year was consistent with that pattern, but the pattern gets better for the remainder of the year. The fourth quarter of the year has historically been the strongest (2), although there is no guarantee that past performance will continue. Since 1950, the average fourth quarter gain was more than 4%, twice as much as the next best quarter.
US large-cap stocks continued to exhibit strength compared to other major equity markets. A significant reason for this discrepancy was a handful of US companies representing an increasingly large weight in the S&P 500. The seven biggest stocks in the S&P500 comprised more than 28% of the index and were up more than 50% so far in 2023 (3). The remaining 493 stocks were almost flat.
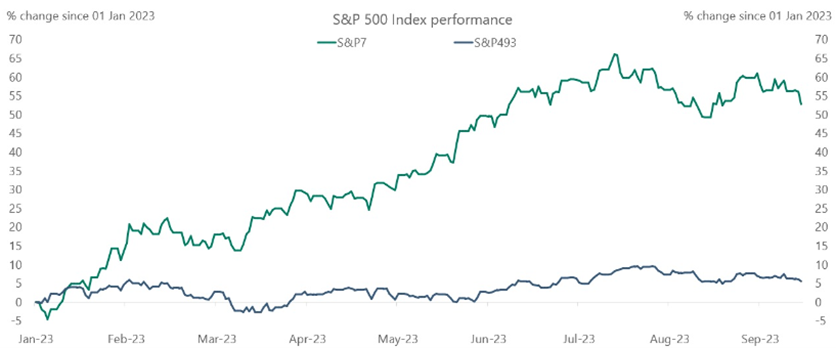
In addition, these seven stocks traded at a price-to-sales (P/S) ratio of 10.8 times. If you exclude those seven, the other 493 companies trade at a more reasonable valuation (P/S ratio of 3.5 times) . When we look under the hood of the S&P 500 or at other major equity markets, like small-cap and non-US stocks, valuations remained at much more significant discounts to fair value than the overall S&P 500 Index. We continued to have substantial positions in areas outside of the top seven companies because we saw a larger margin of safety embedded in their valuations.
Defensive sectors lagged during the quarter, which typically doesn’t happen in “risk off” situations. This, amongst other things, leads us to view this quarter’s decline as a healthy pullback that could set the stage for a year-end rally. The third quarter decline came during a seasonally weak time of the year. It replaced the excessive optimism and overbought conditions of July with extreme pessimism and oversold conditions by the end of the quarter.
Economic Review
The economic environment remained mixed with strong current growth, but many leading indicators pointed toward higher recession risks. Early in 2023, the consensus view was that a global recession was coming later in 2023. But by the middle of the year, the consensus outlook completely shifted to a “soft landing” as the economic data came in strong. During the quarter, economic growth appeared to accelerate. The Atlanta Fed tracked Q3 economic growth at 4.9%, led by a strong labor market, consumer spending, and cooling inflation.
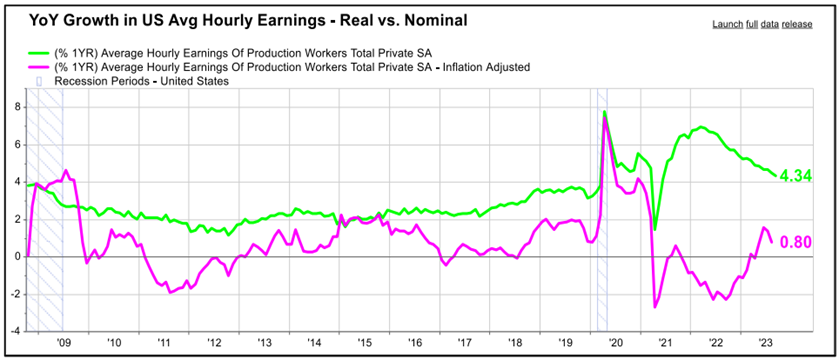
While the unemployment rate continued to hover near record lows, the overall labor market showed early signs of cooling. For instance, job openings—a reliable leading indicator of labor trends—continued to revert to their long-term level. In March of 2022, there were two job openings for every unemployed individual in the economy. By the end of July this year, this ratio had decreased to 1.5 jobs per unemployed person . The more balanced labor market contributed to a moderation in wage gains, slowing to 4.5% year-over-year from a peak of 7% . At the same time, inflation decreased even more than wage gains, resulting in growing real wages, and more fuel for continued consumption. This dynamic kept the risk of higher inflation active. 4% wage growth was still too high to bring down inflation on a longer-term basis. Good progress has been made on supply chain effects, but wage inflation continued to linger as a source of longer-term concern.
We still expect higher interest rates to slow economic growth eventually, but some unique characteristics in this cycle may keep the economy stronger than many expect. Elevated interest rates have affected some interest rate-sensitive sectors like housing and durable goods, but the economy may be less sensitive to higher interest rates compared to past cycles. For example, many businesses and households took out fixed-rate loans when interest rates were extremely low, and they can now earn more interest on their savings than the interest they pay on their debt. As a result, corporate and household balance sheets and debt ratios remained healthy and didn’t point toward any noticeable excesses in the economy.
Another critical driver of the strong economy was government spending. At the same time the Federal Reserve was raising interest rates to cool inflation and slow growth, the federal government engaged in massive fiscal stimulus, running deficits greater than 5% of GDP for the last four years (2020-2023).
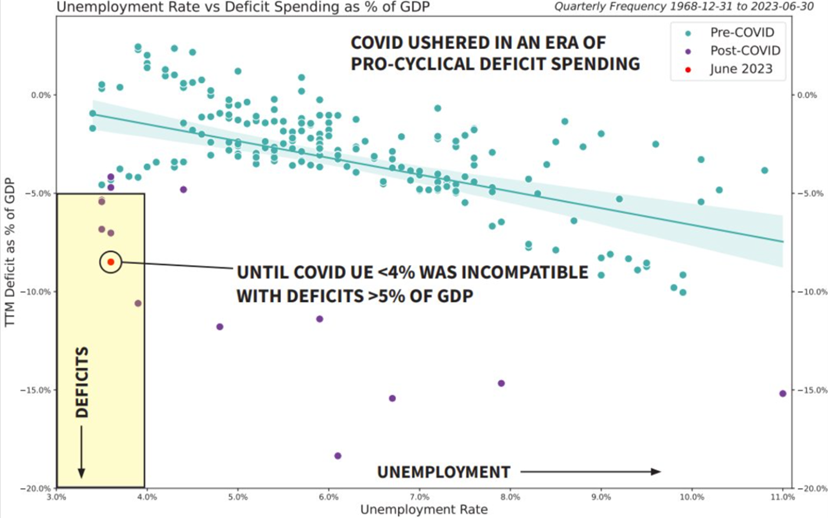
The CHIPS Act provided roughly $280 billion in new funding to boost domestic research and manufacturing of semiconductors in the US. At the same time, The Inflation Reduction Act authorized almost $900 billion of total spending over the next few years, primarily dedicated to manufacturing and infrastructure projects. In the last 50 years, we have never seen such large deficits when the unemployment rate has been so low (see chart (7)). Large deficits have historically been run only when the economy was weak and unemployment was high.
Portfolio Positioning
Our longer-term trend indicators remained intact, but inflation risk, higher rates, and tight monetary policy suggested an unresolved economic environment. Higher interest rates increase the cost of borrowing from everything to mortgages, auto loans, and corporate debt. That will likely impact consumer spending and the economy at some point, but predicting when it will matter remains challenging. We don’t think we are at that point yet, but we are likely getting closer. We have constructed portfolios with a range of potential outcomes in mind, avoiding a bet on any one scenario.
In the short term, we were positioned for market weakness to result in a correction rather than a new bear market. We will attempt to take advantage of the pullback by increasing equity positions. Market sentiment quickly shifted from extreme optimism at the end of July toward pessimism and extremely oversold levels by the end of the quarter. After a weak September, seasonals pointed to a more supportive environment for stocks coming into year-end. And perhaps most importantly, after a year of negative corporate earnings growth, we expect corporate earnings to follow the improvement in economic growth and grow again.
We are now in the midst of the most significant fixed-income sell-off since the 1970s. The transition from ultra-low interest rates to a more normal interest rate environment has been painful for bond investors. Still, our positions in shorter-term bonds and money market funds have helped protect against significant draw downs.
The fundamental value of intermediate bonds looks more attractive than it has in more than a decade. History suggests that higher yields result in increased prospective absolute returns. Real rates—adjusted for inflation—were in positive territory, and the yield on our fixed-income portfolio was higher than it had been in 15 years. We look to stay overweight shorter term bonds until we see a meaningful trend change, at which point we would look to lengthen maturities and lock in high interest rates for longer.
We believe that bonds can be important in a portfolio, especially in a recession. Bonds typically rise in price when there is economic weakness, and stocks typically outperform during economic strength. This dynamic helps to provide ballast during uncertain or “risk-off” market environments.
Performance Review
Equities
Equities were down on the quarter, but we were generally overweight value sectors like Industrials, Energy, Financials, and Materials that outperformed and underweight Technology and defensive sectors that underperformed. We were also underweight non-US and small/mid companies, which helped relative performance.
Fixed Income
Our fixed-income positions were also down on the quarter but by the shorter duration. In particular, we were generally overweight short-term bonds and money market funds, which weren’t as affected by the increase in long-term interest rates.
Alternatives
On balance, alternative positions contributed to performance during the quarter. Positions in the re-insurance and commodities markets helped, while small positions in gold were a detractor. Alternatives continued providing good sources of uncorrelated returns over extended time frames.
Not all portfolios are identical. We manage accounts that have additional complexities not discussed in this update. Some of the statements are forward-looking but do not guarantee future performance. Please reach out to your advisor with any questions.
Sources:
- Morningstar Direct, as of 9/30/2023
- Ibbotson, data back to 1950
- Apollo, data through 9/23/23
- Morningstar Direct, as of 10/3/23
- Federal Reserve Economic Data
- Julex Capital, data from Federal Reserve as of 9/30/23
- 3Fourteen Research, data from 12/31/1968-6/30/2023
INDEX DEFINITIONS
The Barclays Aggregate Bond Index represents securities that are SEC-registered, taxable, and dollar denominated. The index covers the US investment-grade fixed rate bond market, with index components for government and corporate securities, mortgage pass-through securities, and asset-backed securities.
The Standard & Poor’s 500 Index is a capitalization-weighted index of 500 stocks designed to measure performance of the broad domestic economy through changes in the aggregate market value of 500 stocks representing all major industries. It cannot be invested into directly.
The Russell 2000 Index is an unmanaged index generally representative of the 2,000 smallest companies in the Russell Index, which represents approximately 10% of the total market capitalization of the Russell 3000 Index.
The MSCI Emerging Markets Index is a float-adjusted market capitalization index that consists of indices of approximately 800 stocks and is designed to measure equity market performance in 23 emerging economies: Brazil, Chile, China, Colombia, Czech Republic, Egypt, Greece, Hungary, India, Indonesia, Korea, Malaysia, Mexico, , Peru, Philippines, Poland, Qatar, Russia, South Africa, Taiwan, Thailand, Turkey, and the United Arab Emirates.
The MSCI EAFE (Europe, Australasia, Far East) Index is a free float-adjusted market capitalization index of approximately 900 stocks and is designed to measure equity market performance in 21 developed market countries outside of North America.
The SG Trend Index is a subset of the SG CTA Index and follows traders of trend following methodologies. The SG CTA Index is equal weighted, calculates the daily rate of return for a pool of CTAs selected from the larger managers that are open to new investment.
Swiss Re Global Cat Bond Index tracks the aggregate performance of all catastrophe bonds issued offered under Rule 144A. The index captures bonds denominated in any currency, all rated and unrated cat bonds, outstanding perils, and triggers. The index is not exposed to currency risk from non-USD denominated cat bonds.
The Nasdaq Composite Index is a market capitalization-weighted index of more than 3,000 stocks listed on the Nasdaq stock exchange.
Company News
Market Commentary
Retirement Planning
Tax Planning
Cyber Security
Important Disclosures
Leonard Rickey Investment Advisors, PLLC (“LRIA”), is an SEC registered investment adviser located in the State of Washington. Registration does not imply a certain level of skill or training. For information pertaining to the registration status of LRIA, please contact LRIA or refer to the Investment Adviser Public Disclosure website (www.adviserinfo.sec.gov).
This is provided for general information only and contains information that is not suitable for everyone. As such, nothing herein should be construed as the provision of specific investment advice or recommendations for any individual. To determine which investments may be appropriate for you, consult your financial advisor prior to investing. There is no guarantee that the views and opinions expressed herein will come to pass. This newsletter contains information derived from third party sources. Although we believe these third-party sources to be reliable, we make no representations as to the accuracy or completeness of any information prepared by any unaffiliated third party incorporated herein and take no responsibility therefore.
Any projections, forecasts and estimates, including without limitation any statement using “expect” or “believe” or any variation of either term or a similar term, contained here are forward-looking statements and are based upon certain current assumptions, beliefs and expectations that LRIA considers reasonable or that the applicable third parties have identified as such. Forward-looking statements are necessarily speculative in nature, and it can be expected that some or all of the assumptions or beliefs underlying the forward-looking statements will not materialize or will vary significantly from actual results or outcomes. Some important factors that could cause actual results or outcomes to differ materially from those in any forward-looking statements include, among others, changes in interest rates and general economic conditions in the U.S. and globally, changes in the liquidity available in the market, change and volatility in the value of the U.S. dollar, market volatility and distressed credit markets, and other market, financial or legal uncertainties. Consequently, the inclusion of forward-looking statements herein should not be regarded as a representation by LRIA or any other person or entity of the outcomes or results that will be achieved by following any recommendations contained herein. While the forward-looking statements here reflect estimates, expectations and beliefs, they are not guarantees of future performance or outcomes. LRIA has no obligation to update or otherwise revise any forward-looking statements, including any revisions to reflect changes in economic conditions or other circumstances arising after the date hereof or to reflect the occurrence of events (whether anticipated or unanticipated), even if the underlying assumptions do not come to fruition. Opinions expressed herein are subject to change without notice and do not necessarily take into account the particular investment objectives, financial situations, or particular needs of all investors.
For additional information about LRIA, including fees and services, please contact us for our Form ADV disclosure brochure using our contact information herein. Please read the disclosure brochure carefully before you invest or send money.
2026 1st Quarter Investment Commentary