

Nov 13, 2026 2026 3rd Quarter Investment Commentary and November Update
Quarterly data as of September 30, 2026, unless otherwise noted; market update data through November 10, 2026. Published November 2026.
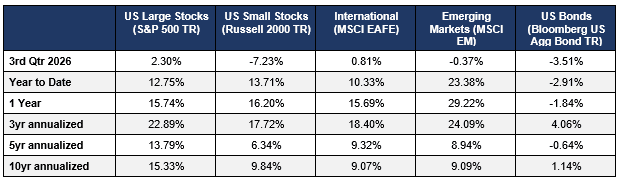
- The U.S. economy remained resilient, but inflation stayed above the Federal Reserve’s 2% target, and in September the Fed raised interest rates for the first time since 2023.
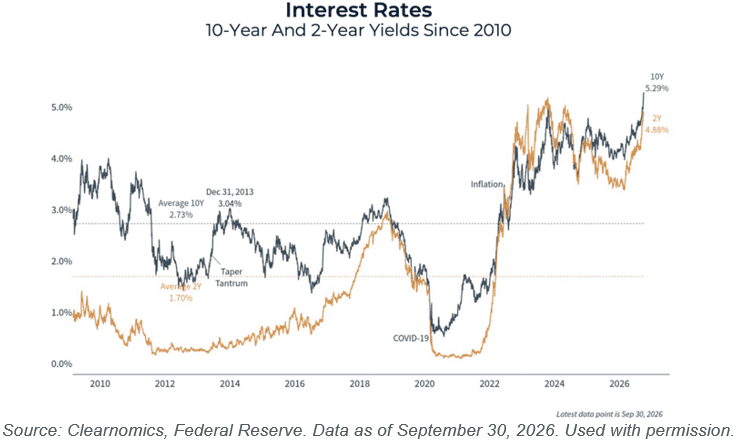
- Bonds suffered their worst quarter in four years as the 10-year Treasury yield climbed to its highest level since 2002.
- Stocks advanced anyway. The S&P 500 gained 2.30%, driven by earnings growth rather than rising valuations, but leadership was narrow: only four of 11 sectors rose, and small caps declined.
- Artificial intelligence (AI) underpinned a substantial share of stock market value, corporate profits, business investment, and corporate borrowing.
Benchmark returns for the period were as follows (1)
Market and Economic Summary
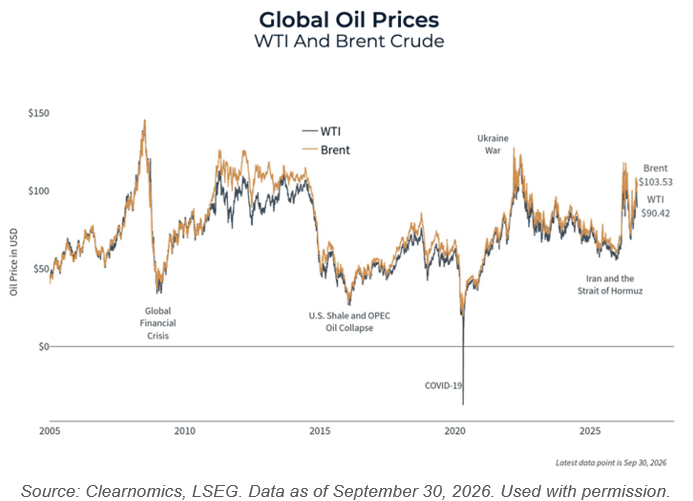
The third quarter brought a sharp rise in interest rates, the Fed’s first rate hike since 2023, and oil back above $100 per barrel. Many investors might have expected stocks to struggle against that backdrop. Instead, the S&P 500 reached record highs, supported by strong corporate earnings.
The economy stayed resilient. Real GDP grew at a 3.4% annualized rate in the third quarter, up from 2.2% in the second, according to the Bureau of Economic Analysis’s advance estimate. (2) The unemployment rate was 4.2% in September, little changed from 4.1% in August. (3) Job openings exceeded the number of unemployed workers for a fifth straight month, and layoffs were just 1.0% of the labor force. (4) One soft spot: average hourly earnings grew about 3.1% from a year earlier, slightly behind inflation. (5) Households also appeared less sensitive to higher borrowing costs than in past cycles, because many locked in low fixed-rate mortgages earlier in the decade.
Oil surged. Renewed fighting involving Iran disrupted shipments through the Strait of Hormuz, pushing Brent crude above $100 per barrel in September. (6) Commodities were the quarter’s strongest major asset class, with the S&P GSCI commodity index up 17.9%. (7)
Inflation persisted, and the Fed resumed tightening. Consumer prices rose 3.4% year over year in August, with gasoline up 27.4%, while core PCE inflation, the Fed’s preferred gauge, stood at 3.0%. (8) On September 16, the Fed raised its policy rate by a quarter point to 3.75%–4.00%, its first increase since July 2023, in a unanimous vote. (9) The reversal in expectations was striking: investors entered 2026 anticipating two rate cuts. (10) Inflation did not ease after quarter-end; September consumer prices rose 3.7% from a year earlier, and the Fed held rates steady at its October meeting. (11)
Bonds posted their worst quarter in four years. The 10-year Treasury yield climbed to its highest level since 2002, (12) propelled by strong growth, sticky inflation, a more hawkish Fed, concern over government debt, and heavy borrowing by companies financing AI infrastructure. (13) Because bond prices move inversely to yields, the broad U.S. bond market lost 3.51% for the quarter, its weakest showing in four years. (14) Maturity determined the damage: long-term Treasury bonds fell 7.65%, while short-term bonds lost less than 1%. (15) Municipal bonds had their worst quarterly loss in 45 years.(16)
There is a silver lining in higher starting yields. Vanguard estimated that, at late-September yield levels, U.S. Treasuries with maturities of up to 10 years would not lose money over the following year even if rates rose another 50 basis points, a stark contrast with 2022. (17)
Stocks advanced on earnings, not valuations. The S&P 500 gained 2.30% for the quarter and 12.75% year to date. Earnings did the heavy lifting: analysts expected third-quarter S&P 500 earnings to grow about 29% from a year earlier and, unusually, raised their estimates as the quarter progressed. (18) Since June 30, forward earnings estimates rose 8.9% while the index rose 2.7%, so the forward price-to-earnings ratio fell from 20.4 to 19.2. Stocks became less expensive relative to profits even as prices climbed. (19) In prior years, rapid earnings growth was typically accompanied by expanding valuations; this year the opposite occurred. (20)
Leadership was narrow. Only four of the 11 S&P 500 sectors advanced, led by energy (+16.5%) and technology (+7.1%), while utilities (−13.0%) and industrials (−9.9%) fell the most. (21) Small-cap stocks lost 7.23%, in part because smaller companies rely more on floating-rate and short-term debt and feel higher rates sooner. (22) Fewer stocks participating in gains can leave the market more vulnerable to setbacks.
One Theme, Many Markets
The most consequential story of the quarter may not have been interest rates or oil, but the extent to which the financial system came to depend on a single theme: artificial intelligence. Concentration is hardly new, yet this quarter it surfaced in four places at once.
In U.S. stocks. Technology stocks made up nearly 40% of the S&P 500 (23), and the 10 largest companies accounted for nearly 40% of the index, well above the long-term average. (24)
In emerging market stocks. The pattern extended abroad. The 10 largest stocks in the MSCI Emerging Markets Index, all AI-related, made up 36% of the index, and technology represented more than one-third of the market. (25) An investor who bought emerging markets to diversify away from U.S. technology may well have ended up owning substantial AI exposure anyway.
In profits and the economy. Technology-sector revenue was expected to grow 40% in the third quarter, led by semiconductor companies at roughly 80%. (26) Amazon, Alphabet, Meta, and Microsoft were expected to spend a combined $721 billion on capital investment in 2026, nearly double the $376 billion they spent in 2025. (27) Data-center construction surged, yet total private construction spending in September remained below its level at the end of 2023. (28) And AI had not yet produced meaningful gains in worker productivity, which grew just 1.4% in the second quarter. (29)
In the bond market. Large technology companies increasingly turned to debt to finance data centers. Goldman Sachs estimated that hyperscalers issued $229 billion of debt this year through the third quarter and that issuance could reach $420 billion in 2027; earlier in the year, AI-related debt accounted for about 15% of the corporate bond universe. (30) That borrowing competes with the U.S. Treasury for investors’ capital and adds to upward pressure on interest rates.
Why it matters. There is a credible case that this concentration rests on real fundamentals: the largest AI spenders are among the most profitable companies in the world, and valuations declined this year even as profits soared, which is not the hallmark of a conventional bubble. The risk is that when the same small group of companies drives stock returns, earnings growth, business investment, and corporate borrowing, a setback in any one area can spread rapidly to the others. On a longer-term valuation measure, the Shiller P/E, which compares prices with 10 years of inflation-adjusted earnings, was above 40 in September, a level last seen in 1999–2000. (31) For investors, the practical question is how much of a portfolio depends on this one theme, sometimes in places they may not expect.
Market Update: A Volatile Start to November
Data through November 10, 2026
Since quarter-end, markets have been choppy without establishing a clear direction. Between October 29 and November 9 the S&P 500 fell about 2.2%, but that number hides the swings along the way: a 1.6% gain on November 4, a 4.4% drop on November 5, and a 2.3% rebound on November 9. (32) The VIX, a widely followed gauge of expected stock market volatility, jumped from 16.6 on November 4 to 28.2 on November 5 before settling back near 20. (33)
Through the first ten days of the month the major U.S. indexes were little changed on net, with the Dow Jones Industrial Average up 0.9%, the S&P 500 down 0.8%, and the Nasdaq Composite down 1.5%, the latter reflecting a 4.4% single-day decline on November 5. (34) Beneath the surface, the rotation was pronounced: communication services (+7.9%), consumer discretionary (+4.9%), real estate (+3.3%), and financials (+3.2%) led, while technology (−5.9%) and energy (−11.2%) fell sharply. (35)
This volatility arrived alongside the November 3 midterm elections, and it is natural to connect the two. History suggests caution in doing so: election years are not inherently more volatile, and markets have grown under a wide range of political outcomes; what has tended to matter for returns is the underlying economic backdrop, not which party prevails. (36) The sharper moves this month have been concentrated in technology and energy, the two sectors that led the market in the third quarter, which suggests the same themes discussed above — AI concentration, interest rates, and oil — remain the primary drivers. We will continue to monitor these developments.
None of the above is a prediction or guarantee. Markets remain subject to change based on incoming economic data, policy developments, and geopolitical events.
FOOTNOTES:
- Morningstar Direct, as of 9/30/2026. Indexes are unmanaged and cannot be invested in directly. Returns are total return unless noted.
- U.S. Bureau of Economic Analysis, Gross Domestic Product, Third Quarter 2026 (Advance Estimate), released October 29, 2026; FRED series A191RL1Q225SBEA.
- U.S. Bureau of Labor Statistics, The Employment Situation — September 2026; FRED series UNRATE.
- DataTrek Research, October 2026.
- U.S. Bureau of Labor Statistics, average hourly earnings of all private employees, year-over-year, September 2026; FRED series CES0500000003.
- Clearnomics, Global Oil Prices chart, data as of 9/30/2026 (sources: Clearnomics, LSEG). Brent closed the quarter at $103.53.
- Ned Davis Research, Market Digest, October 7, 2026, asset-class benchmark returns.
- Clearnomics, Q4 2026 Outlook; U.S. Bureau of Labor Statistics, CPI August 2026 (FRED series CPIAUCSL).
- Federal Reserve, FOMC statement, September 16, 2026.
- Avantis Investors, Q3 2026 Market Review.
- U.S. Bureau of Labor Statistics, CPI September 2026 (FRED series CPIAUCSL); Federal Reserve, FOMC statement, October 28, 2026.
- Ned Davis Research, Market Digest, October 7, 2026.
- Morningstar, Q3 2026 Market Review, October 1, 2026.
- Avantis Investors, Q3 2026 Market Review (Bloomberg U.S. Aggregate Bond Index); Ned Davis Research, Market Digest, October 7, 2026.
- Morningstar, Q3 2026 Market Review, October 1, 2026.
- Ned Davis Research, Market Digest, October 7, 2026.
- Vanguard, Market Perspectives, September 29, 2026. This is a third-party estimate based on stated assumptions and is not a guarantee.
- James Investment Research, Q4 2026 Economic Outlook, citing FactSet (29.1% expected growth, up from 26.7% on June 30).
- James Investment Research, Q4 2026 Economic Outlook, citing FactSet.
- Vanguard, Market Perspectives, September 29, 2026.
- Ned Davis Research, Market Digest, October 7, 2026, S&P 500 sector benchmark returns.
- Morningstar Direct (Russell 2000 TR); Carson Research, September 15, 2026.
- The Chartist, October 1, 2026.
- Capital Group, S&P 500 top-10 concentration, data through August 31, 2026 (sources: Capital Group, FactSet).
- Morningstar, Q3 2026 Market Review, October 1, 2026.
- Carson Research, September 15, 2026.
- James Investment Research, Q4 2026 Economic Outlook, citing Bloomberg.
- U.S. Census Bureau, Value of Private Construction Put in Place, seasonally adjusted annual rate; FRED series TLPRVCONS ($1,684 billion in December 2023 vs. $1,639 billion in September 2026).
- Clearnomics, Q4 2026 Outlook (nonfarm business productivity).
- Morningstar, Q3 2026 Market Review, October 1, 2026 (Goldman Sachs estimates; Morningstar Wealth).
- Robert J. Shiller, Online Data (Yale University), CAPE ratio: 40.6 for September 2026; readings above 40 last occurred January 1999 through September 2000.
- S&P 500 daily closes, FRED series SP500 (S&P Dow Jones Indices): 7,720 on 10/29, 7,689 on 11/4, 7,354 on 11/5, 7,550 on 11/9/2026. Price returns, excluding dividends.
- CBOE Volatility Index (VIX), daily close, FRED series VIXCLS.
- Koyfin, index price returns, November 1–10, 2026.
- Koyfin, Select Sector SPDR ETF price returns, November 2–10, 2026. Sector ETFs are used as proxies for S&P 500 sectors.
- Clearnomics, “Midterm Elections: Long-Term Perspectives,” Q4 2026. Since 1933 the S&P 500 has averaged an 8.6% annual total return in midterm election years.
IMPORTANT DISCLOSURES
Portions of this commentary were prepared with the assistance of artificial intelligence tools and reviewed by LRIA personnel, and all investment-related content reflects the views of Leonard Rickey Investment Advisors, P.L.L.C.
Leonard Rickey Investment Advisors, PLLC (“LRIA”), is an SEC registered investment adviser located in the State of Washington. Registration does not imply a certain level of skill or training. For information pertaining to the registration status of LRIA, please contact LRIA or refer to the Investment Adviser Public Disclosure website (www.adviserinfo.sec.gov). This material is for informational purposes only and is not individualized investment, tax, or legal advice. This material is educational in nature and does not describe LRIA’s portfolio positioning or recommend any security, strategy, or asset allocation. Opinions are as of November 2026 and may change. To determine which investments may be appropriate for you, consult your financial advisor prior to investing. All performance referenced herein is historical in nature and is not an indication of or a guarantee of future results. All indices are unmanaged and cannot be invested into directly. Unmanaged index returns do not reflect fees, expenses, or sales charges. Index performance is not indicative of the performance of any investment.
Your experience may vary according to your individual circumstances and there can be no assurance that LRIA will be able to achieve similar results for all clients in comparable situations or that any strategy or investment will prove profitable. As investment returns, inflation, taxes and other economic conditions vary, your actual results may vary significantly. The economic forecasts set forth herein may not develop as predicted and there can be no guarantee that strategies promoted will be successful. There is no guarantee that the views and opinions expressed herein will come to pass. This commentary contains information derived from third party sources. Although we believe these third-party sources to be reliable, we make no representations as to the accuracy or completeness of any information prepared by any unaffiliated third party incorporated herein, and take no responsibility, therefore. Third-party charts are reproduced with permission.
Stock investing includes numerous specific risks including the fluctuations of dividend, loss of principal, and potential illiquidity of the investment in a falling market. International and emerging markets investing involves special risks such as currency fluctuation and political instability and may not be suitable for all investors. Small cap stocks may be subject to a higher degree of risk than more established companies’ securities. The illiquidity of the small cap market may adversely affect the value of these investments. Information presented herein is subject to change without notice and should not be considered as a solicitation to buy or sell any security. This commentary should not be regarded as a complete analysis of the subjects discussed. Bonds are subject to market and interest rate risk if sold prior to maturity. Bond values and yields will decline as interest rates rise and bonds are subject to availability and change in price. The risks associated with investment-grade corporate bonds are considered significantly higher than those associated with U.S. Treasury securities. The fast price swings in commodities and currencies can result in significant volatility in an investor’s holdings. There is no assurance that the techniques and strategies discussed are suitable for all investors or will yield positive outcomes. Value investments can perform differently from the market as a whole and can remain undervalued by the market for long periods of time. References to specific companies are for illustrative purposes only and do not constitute a recommendation to buy or sell any security; LRIA and its related persons may hold positions in the securities mentioned.
Any projections, forecasts and estimates, including without limitation any statement using “expect” or “believe” or any variation of either term or a similar term, contained here are forward-looking statements and are based upon certain current assumptions, beliefs and expectations that LRIA considers reasonable or that the applicable third parties have identified as such. Forward-looking statements are necessarily speculative in nature, and it can be expected that some or all the assumptions or beliefs underlying the forward-looking statements will not materialize or will vary significantly from actual results or outcomes. Some important factors that could cause actual results or outcomes to differ materially from those in any forward-looking statements include, among others, changes in interest rates and general economic conditions in the US and globally, changes in the liquidity available in the market, change and volatility in the value of the US dollar, market volatility and distressed credit markets, and other market, financial or legal uncertainties. Consequently, the inclusion of forward-looking statements herein should not be regarded as a representation by LRIA or any other person or entity of the outcomes or results that will be achieved by following any recommendations contained herein. While the forward-looking statements here reflect estimates, expectations and beliefs, they are not guarantees of future performance or outcomes. LRIA has no obligation to update or otherwise revise any forward-looking statements, including any revisions to reflect changes in economic conditions or other circumstances arising after the date hereof or to reflect the occurrence of events (whether anticipated or unanticipated), even if the underlying assumptions do not come to fruition. Opinions expressed herein are subject to change without notice and do not necessarily consider the particular investment objectives, financial situations, or particular needs of all investors. For additional information about LRIA, including fees and services, please contact us for our Form ADV disclosure brochure at [PHONE] or [EMAIL]. Please read the disclosure brochure carefully before you invest or send money.
INDEX DEFINITIONS
The Standard & Poor’s 500 Index is a float-adjusted, market capitalization-weighted index of 500 leading U.S. companies designed to measure the performance of the large-cap segment of the U.S. equity market. The index represents approximately 80% of the available U.S. equity market capitalization. The index cannot be invested in directly.
The Russell 2000 Index is a market capitalization-weighted index that measures the performance of the small-cap segment of the U.S. equity market. It consists of approximately 2,000 of the smallest companies in the Russell 3000 Index.
The MSCI EAFE (Europe, Australasia and Far East) Index is a free float-adjusted, market capitalization-weighted index designed to measure the equity market performance of large- and mid-cap companies across developed market countries outside the United States and Canada.
The MSCI Emerging Markets Index is a free float-adjusted, market capitalization-weighted index designed to measure the equity market performance of large- and mid-cap companies across emerging market countries.
The Bloomberg US Aggregate Bond Index measures the performance of the U.S. dollar-denominated, investment-grade, fixed-rate taxable bond market, including U.S. Treasury securities, government-related and corporate bonds, mortgage-backed securities, commercial mortgage-backed securities, and asset-backed securities.
The S&P GSCI is a composite index of commodity sector returns representing an unleveraged, long-only investment in commodity futures, broadly diversified across the spectrum of commodities.
The Dow Jones Industrial Average is a price-weighted average of 30 large U.S. companies. The Nasdaq Composite Index is a market capitalization-weighted index of securities listed on the Nasdaq Stock Market. The CBOE Volatility Index (VIX) measures the market’s expectation of 30-day volatility implied by S&P 500 index options. Select Sector SPDR ETFs are exchange-traded funds that track S&P 500 sector indexes; references to them are for illustration only and are not recommendations.
The Shiller P/E (cyclically adjusted price-to-earnings ratio, or CAPE) divides the real price of the S&P 500 by the average of the prior 10 years of real earnings, as compiled by Robert J. Shiller.
Company News
Market Commentary
Retirement Planning
Tax Planning
Cyber Security
Important Disclosures
Leonard Rickey Investment Advisors, PLLC (“LRIA”), is an SEC registered investment adviser located in the State of Washington. Registration does not imply a certain level of skill or training. For information pertaining to the registration status of LRIA, please contact LRIA or refer to the Investment Adviser Public Disclosure website (www.adviserinfo.sec.gov).
This is provided for general information only and contains information that is not suitable for everyone. As such, nothing herein should be construed as the provision of specific investment advice or recommendations for any individual. To determine which investments may be appropriate for you, consult your financial advisor prior to investing. There is no guarantee that the views and opinions expressed herein will come to pass. This newsletter contains information derived from third party sources. Although we believe these third-party sources to be reliable, we make no representations as to the accuracy or completeness of any information prepared by any unaffiliated third party incorporated herein and take no responsibility therefore.
Any projections, forecasts and estimates, including without limitation any statement using “expect” or “believe” or any variation of either term or a similar term, contained here are forward-looking statements and are based upon certain current assumptions, beliefs and expectations that LRIA considers reasonable or that the applicable third parties have identified as such. Forward-looking statements are necessarily speculative in nature, and it can be expected that some or all of the assumptions or beliefs underlying the forward-looking statements will not materialize or will vary significantly from actual results or outcomes. Some important factors that could cause actual results or outcomes to differ materially from those in any forward-looking statements include, among others, changes in interest rates and general economic conditions in the U.S. and globally, changes in the liquidity available in the market, change and volatility in the value of the U.S. dollar, market volatility and distressed credit markets, and other market, financial or legal uncertainties. Consequently, the inclusion of forward-looking statements herein should not be regarded as a representation by LRIA or any other person or entity of the outcomes or results that will be achieved by following any recommendations contained herein. While the forward-looking statements here reflect estimates, expectations and beliefs, they are not guarantees of future performance or outcomes. LRIA has no obligation to update or otherwise revise any forward-looking statements, including any revisions to reflect changes in economic conditions or other circumstances arising after the date hereof or to reflect the occurrence of events (whether anticipated or unanticipated), even if the underlying assumptions do not come to fruition. Opinions expressed herein are subject to change without notice and do not necessarily take into account the particular investment objectives, financial situations, or particular needs of all investors.
For additional information about LRIA, including fees and services, please contact us for our Form ADV disclosure brochure using our contact information herein. Please read the disclosure brochure carefully before you invest or send money.
2026 2nd Quarter Investment Commentary