

Jul 29, 2026 2026 2nd Quarter Investment Commentary
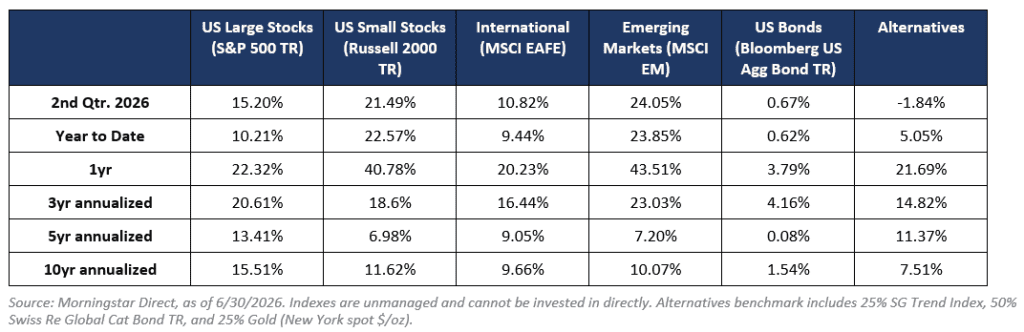
- The second quarter delivered a sharp rebound. As the Iran conflict de-escalated and oil prices returned to pre-conflict levels near $72 per barrel, the S&P 500 gained 15.2%—its best quarter since 2020—bringing its first-half return to 10.2%.
- Monetary policy shifted under new Fed Chair Kevin Warsh. The Fed held rates at 3.50%–3.75% but removed forward guidance, and officials ended the quarter evenly split between holding steady and raising rates before year-end—a marked change from the rate cuts investors expected in January. Headline inflation reached 4.2%, though core inflation of 2.9% suggested the pressure was largely energy-driven.
- Market breadth was a bright spot: emerging markets, small caps, and international stocks all posted strong gains, and the average stock outpaced the index. With U.S. large-cap valuations elevated, market concentration at record levels, and excess enthusiasm for AI investment, we continue to emphasize diversification across styles, market capitalizations, and regions, and favor high-quality short- and intermediate-term bonds.
Market and Economic Summary
The second quarter was, in many ways, a mirror image of the first. Where Q1 was defined by the shock of the Iran conflict—surging oil prices, renewed inflation fears, and a market selloff—Q2 was defined by relief. As hostilities de-escalated and a memorandum of understanding was signed on June 17, the geopolitical risk premium markets had priced in returned. Brent crude, which had briefly traded above $120 at the height of the conflict, finished the quarter near $72, roughly its pre-war level, and gasoline prices retreated from a peak above $4.50 per gallon to under $4.00.[1] In the space of three months, markets traveled from pricing a war to pricing its absence.
The recovery was broad and powerful. The S&P 500 gained 15.2% for the quarter—its best since 2020—and had set roughly two dozen new all-time highs this year despite the turbulence. Just as encouraging, strength was not confined to U.S. large caps: emerging markets returned roughly 24% for the quarter, led by South Korea and Taiwan, small-cap stocks posted strong double-digit gains, and international developed markets advanced more than 10%.[2] For diversified portfolios, this breadth—across regions, sizes, and styles—was one of the most constructive developments of the first half.
The character of the AI trade also shifted. Leadership moved from the familiar mega-caps to the “picks-and-shovels” side of the theme: semiconductors, memory producers, and networking hardware posted some of the largest quarterly gains on record as hyperscaler capital spending accelerated and memory shortages allowed suppliers to raise prices. Technology was the quarter’s leading sector, rising nearly 32%, while energy—the first quarter’s standout—was the weakest at roughly -14% as oil retreated.[3]
Dispersion beneath the surface was striking: semiconductor-related industries gained nearly 50% for the quarter while telecommunications, media, and traditional energy industries posted double-digit declines. Tech-heavy markets like South Korea and Taiwan also performed well as AI beneficiary earnings expectations rose, while non-tech-heavy markets like Europe didn’t perform as well.[4] Notably, when several technology names pulled back sharply in June, Health Care, Industrials, and Financials held their ground—a sign of healthy broadening into other sectors of the market.
Corporate earnings remained the fundamental backbone of the advance. Earnings estimates were growing faster than they did in the mid-90s or late internet bubble years.[5] Both realized profits and upwardly revised earnings expectations, rather than valuation expansion, contributed to gains. S&P 500 earnings grew more than 20% over the past year, every sector posted positive earnings growth, and consensus expectations for 2026 earnings growth stood near 23% at quarter-end—with estimates revised upward throughout the year.[6]
The economy remained mixed but not recessionary. First-quarter real GDP grew at a 2.0% annual rate, powered by a surge in business investment: high-tech capital spending tied to the AI buildout accounted for roughly two-thirds of the quarter’s growth.[7] The labor market, which had been the economy’s soft spot in 2025, strengthened meaningfully—payroll gains averaged roughly 111,000 per month from April through June, up from an average of just 10,000 per month last year, and the unemployment rate fell to 4.2%, well below its long-run average. Wage growth of 3.5% was once again outpacing core inflation, supporting real incomes.[8] Consumers proved more resilient than expected in the face of higher energy prices, though slowing real disposable income growth and weak sentiment suggested spending may moderate in the second half. The economy remained notably bifurcated: AI-related investment was booming while growth across the rest of the economy was sluggish.
Inflation remained the central complication—but its composition mattered. Headline CPI reached 4.2% year-over-year in May, its highest reading in several years, driven overwhelmingly by energy. Core inflation, which excludes food and energy, rose a more moderate 2.9%.[9] With oil prices back near pre-conflict levels, headline inflation might have been near a high point—though core inflation had spent five consecutive years above the Federal Reserve’s 2% target, and “improvement” meant slower price increases, not lower prices.
Against that backdrop, the Federal Reserve underwent its most significant transition in years. Kevin Warsh was confirmed as Fed Chair in May, succeeding Jerome Powell, and his first meeting in June brought immediate changes: a shortened policy statement, the removal of forward guidance, and new working groups studying the Fed’s communications, inflation framework, and balance sheet. The Committee held rates at 3.50%–3.75%, but its projections revealed a split—roughly half of officials expected rates to hold through year-end, while the other half expected hikes.[10] Markets that began the year pricing one to two rate cuts ended the quarter pricing the possibility of hikes instead.
In the bond market, the repricing of Fed expectations pushed yields higher, with the 10-year Treasury finishing near 4.5% and the 2-year near 4.2%.[11] The silver lining of elevated rates was income: yields across virtually every major fixed-income sector were above their post-2009 averages, with the broad U.S. bond index yielding roughly 4.7%.[12] Those starting yields cushioned returns, and the bond index finished the quarter with a modest gain. Gold, notably, did not act as a haven: it fell roughly 13% for the quarter—its largest decline since 2013—as markets priced in a firmer dollar and attractive Treasury yields, though it remained meaningfully higher than a year ago.[13]
Below is a summary of benchmark returns.
Outlook: What We’re Watching
The primary trend for equities was upward, and we remain constructive on stocks. The technical backdrop is supported by improving credit spreads, stronger earnings revisions, healthy rotation into cyclical sectors, and lower oil prices following the Iran ceasefire. From a regional perspective, the U.S. has regained leadership after underperforming earlier in the year, while Europe has weakened materially due to energy sensitivity and deteriorating growth expectations. Emerging markets continue to outperform selectively, particularly in AI-linked Asian economies and commodity exporters. Still, the rally has moved quickly, the AI trade shows stretched technical conditions, and inflation remains sticky enough to keep the Fed cautious. Several of these developments warrant continued attention.
First, inflation and the path of interest rates. If the energy-driven inflation spike fades, the Fed could hold rates steady; if inflation broadens—or the still-fragile ceasefire with Iran unravels and oil spikes again—the shift toward rate hikes could pressure both bond and stock valuations. The new Fed chair has deliberately reduced forward guidance, which means markets may have to navigate policy decisions with less advance signaling than they have grown accustomed to, potentially leading to higher volatility.
On the AI buildout, a point of tension has come into focus between the durability of near-term earnings momentum and the ability of AI investment to deliver broad-based, sustainable profitability over the medium term. Near term, the forces supporting earnings appear likely to persist: AI capital spending by the largest technology companies has climbed from roughly $227 billion in 2024 to $391 billion in 2025, with 2026 guidance approaching $700 billion.[14] A relatively small group of roughly 70 companies globally—the “AI complex” of hyperscalers and the semiconductor, data center, and networking companies that supply them—is expected to generate more than half of all U.S. earnings growth this year and next. Most hyperscalers appear able to balance continued earnings growth with the demands of funding historic capital expenditure.[15]
Our medium-term outlook is more guarded. The historic scale of investment raises the question of whether returns will ultimately justify the capital deployed; outcomes are unlikely to be uniform, and parts of the AI complex could prove vulnerable if spending slows.[16] Also, the question that will ultimately determine returns is not just who builds AI infrastructure, but who captures its economic benefits: as adoption broadens, opportunity may shift beyond the AI complex to U.S. value stocks and developed markets, where companies can improve productivity without bearing the upfront investment costs. With market drivers increasingly concentrated around AI, and momentum reading at extremes, investors should expect a bumpy ride.
Valuations and concentration remain a concern. The S&P 500 trades near 20x forward earnings versus a long-term average around 16x, and the Shiller P/E has climbed to roughly 40 – a level last seen during the dot-com era.[17] Whether those valuations prove justified depends on whether earnings momentum can be sustained. So far, AI-related revenues have translated into strong profits. High valuation readings do not predict what the market will do next, but they do affect asset allocation decisions. Many market segments—U.S. value, small caps, and international markets trading closer to their long-run valuation averages—remain comparatively under-owned.
The AI theme has not broken, but it is no longer early, and enthusiasm is widespread. The 10 largest companies now represent nearly 40% of the S&P 500—a level not seen since the mid-1960s—semiconductor-related companies are approaching one-fifth of the index, and the exposure is even more acute in emerging markets, where three companies represent 29% of the MSCI EM Index.[18] At today’s weights and valuations, the benchmarks and the passive strategies that follow them increasingly assume one set of outcomes will dominate. Markets have seen this before: fossil fuels accounted for 29% of the S&P 500 in 1980, versus roughly 3% today; Japan reached 44% of the MSCI World Index at the peak of its late-1980s boom, versus around 5% today.[19] These are not perfect analogs, and concentration is not a timing tool—but historically, index leadership has often rotated.
Within equities, we continue to believe leaning into more reasonably valued market segments, both U.S. and non-U.S., may help diversify potential outcomes should AI’s benefits diffuse more broadly through the global economy. Within fixed income, today’s yields—above their post-crisis averages across nearly every sector—have restored bonds’ traditional role as income generators and portfolio stabilizers. At the same time, persistent inflation, heavy government borrowing, and deficit-driven supply keep us cautious on longer-duration bonds, so we continue to favor high-quality short- and intermediate-term strategies.
Not all portfolios are identical. We manage accounts with additional complexities that were not discussed in this update. Please reach out to your advisor with any questions.
None of the above is a prediction or guarantee. Markets remain subject to change based on incoming economic data, policy developments, and geopolitical events. We continue to emphasize diversification, risk awareness, and alignment with each client’s long-term objectives.
[AI ASSISTED]
[1] Clearnomics: 2026 Mid- Year Outlook
[2]Morningstar Direct, as of 6/30/2026.
[3]Ned Davis Research: Quarterly Insights Q2 2026
[4]Ned Davis Research: Quarterly Insights Q2 2026
[5]3Fourteen Research, May 2nd 2026
[6]BlackRock: Weekly Market Commentary, July 6th 2026, Clearnomics: 2026 Mid- Year Outlook
[7]U.S. Bureau of Economic Analysis, first-quarter 2026 GDP
[8]Clearnomics: 2026 Mid- Year Outlook, U.S. Bureau of Labor Statistics — nonfarm payrolls, unemployment rate, and average hourly earnings.
[9]U.S. Bureau of Labor Statistics — Consumer Price Index, May 2026
[10]Federal Reserve, June 2026 FOMC statement and Summary of Economic Projections.
[11]Koyfin as of 6/30/2026
[12]Clearnomics: 2026 Mid- Year Outlook, Bloomberg US Aggregate Bond Index
[13]Morningstar Direct (DJ Commodity Gold TR USD)
[14]Cornell Capital Group: Q2 2026 Quarterly Investor Memo
[15]Vanguard Market Perspectives, June 26th 2026
[16]Cornell Capital Group: Q2 2026 Quarterly Investor Memo
[17]Blackrock: Weekly Market Commentary, July 6th 2026
[18]Capital Group: Unique Market Moment, 7/8/2026, FactSet, S&P Global — S&P 500 top-10 index concentration and historical benchmark weights, as of 6/30/2026.
[19]Capital Group: Unique Market Moment, 7/8/2026
Company News
Market Commentary
Retirement Planning
Tax Planning
Cyber Security
Important Disclosures
Leonard Rickey Investment Advisors, PLLC (“LRIA”), is an SEC registered investment adviser located in the State of Washington. Registration does not imply a certain level of skill or training. For information pertaining to the registration status of LRIA, please contact LRIA or refer to the Investment Adviser Public Disclosure website (www.adviserinfo.sec.gov).
This is provided for general information only and contains information that is not suitable for everyone. As such, nothing herein should be construed as the provision of specific investment advice or recommendations for any individual. To determine which investments may be appropriate for you, consult your financial advisor prior to investing. There is no guarantee that the views and opinions expressed herein will come to pass. This newsletter contains information derived from third party sources. Although we believe these third-party sources to be reliable, we make no representations as to the accuracy or completeness of any information prepared by any unaffiliated third party incorporated herein and take no responsibility therefore.
Any projections, forecasts and estimates, including without limitation any statement using “expect” or “believe” or any variation of either term or a similar term, contained here are forward-looking statements and are based upon certain current assumptions, beliefs and expectations that LRIA considers reasonable or that the applicable third parties have identified as such. Forward-looking statements are necessarily speculative in nature, and it can be expected that some or all of the assumptions or beliefs underlying the forward-looking statements will not materialize or will vary significantly from actual results or outcomes. Some important factors that could cause actual results or outcomes to differ materially from those in any forward-looking statements include, among others, changes in interest rates and general economic conditions in the U.S. and globally, changes in the liquidity available in the market, change and volatility in the value of the U.S. dollar, market volatility and distressed credit markets, and other market, financial or legal uncertainties. Consequently, the inclusion of forward-looking statements herein should not be regarded as a representation by LRIA or any other person or entity of the outcomes or results that will be achieved by following any recommendations contained herein. While the forward-looking statements here reflect estimates, expectations and beliefs, they are not guarantees of future performance or outcomes. LRIA has no obligation to update or otherwise revise any forward-looking statements, including any revisions to reflect changes in economic conditions or other circumstances arising after the date hereof or to reflect the occurrence of events (whether anticipated or unanticipated), even if the underlying assumptions do not come to fruition. Opinions expressed herein are subject to change without notice and do not necessarily take into account the particular investment objectives, financial situations, or particular needs of all investors.
For additional information about LRIA, including fees and services, please contact us for our Form ADV disclosure brochure using our contact information herein. Please read the disclosure brochure carefully before you invest or send money.
2026 1st Quarter Investment Commentary