Mar 25, 2019 Not your Grandma’s Dow
Not Your Grandma’s Dow
A quick online search for “Dow rallies 500 points” yields a cascade of news stories with similar titles, as does a similar search for “Dow drops 500 points.”
These types of headlines may make little sense to some investors, given that a “point” for the Dow and what it means to an individual’s portfolio may be misleading. The potential for misunderstanding also exists among even experienced market participants, given that index levels have risen over time and potential emotional anchors, such as a 500-point move, do not have the same impact on performance as they used to. With this in mind, we examine what a point move in the Dow means and the impact it may have on an investment portfolio.
Headlines vs. Reality
Movements in the Dow are often communicated in points, which signify the change in the index level. Investors should be cautious when interpreting headlines that reference point movements. A move of 500 points in either direction is less meaningful now than in the past because the overall index level is higher today than it was many years ago.
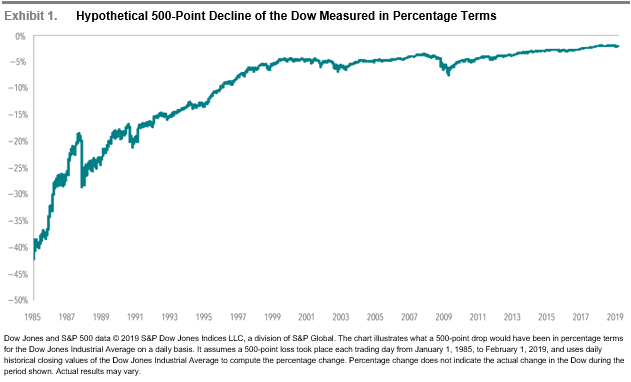
Exhibit 1 plots what a decline of this magnitude has meant in percentage terms over time. A 500-point drop in January 1985, when the Dow was near 1,300, equated to a nearly 39% loss. A 500-point drop in December 2003, when the Dow was near 10,000, meant a much smaller 5% decline in value. And a 500-point drop in early December 2018, when the Dow hovered near 25,000, resulted in a 2% loss. It’s important for investors to be aware of this impact when reacting to point declines from years ago to point declines today.
Impact of Index Construction
The Dow Jones Industrial Average was created in 1896 by The Wall Street Journal founder, Charles Dow. It currently consists of 30 U.S. stocks and is priced weighted, which is different than more common market capitalization-weighted indices such as the S&P 500 Index.[1]
Consider two companies that have a total market capitalization of $1,000. Company A has 1,000 shares outstanding that trade at $1 each, and Company B has 100 shares outstanding that trade at $10 each. In a market capitalization-weighted index, both companies would have the same weight since their total market caps are the same. However, in a price-weighted index, Company B would have a 10-times weight due to its higher stock price. This means that changes in Company B’s stock price would be more impactful to a price-weighted index than they would be to a market cap-weighted index.
We don’t have to look far for a real-world example of how this unique weighing can skew the performance on the Dow. As of March 9, 2019 Boeing, was the highest priced stock in the Dow trading at $420 per share and represented about 11% of the index. Pfizer was the lowest priced stock at $41 per share and represented about 1% of the index. In a market capitalization index like the S&P 500, Pfizer actually had a greater weight than Boeing (1.07% vs.89%).
On March 11, 2019 Boeing was down over 5%, which led to a much larger impact on the Dow compared to market capitalization indices. More importantly, comparing your portfolio to the Dow on this day could be misleading because most likely your stock portfolio doesn’t have near an 11% weighting in Boeing.
How Does the Dow Relate to Your Portfolio?
Arguably, the Dow is still the most important measure of U.S. equity prices when it comes to how Main Street judges Wall Street performance. The Dow is frequently interpreted as an indicator of broader stock market performance, but the stocks composing the index are not representative of a client’s total portfolio.
For context, the MSCI All Country World Investable Market Index (MSCI ACWI IMI) covers just over 8,700 large, mid, and small cap stocks in 23 developed and 24 emerging markets countries with a combined market cap of more than $50 trillion. The S&P 500 includes 505 large cap US stocks with approximately $23.8 trillion in combined market cap.[1] The Dow is a collection of 30 large cap US stocks with a combined market cap of approximately $6.8 trillion.[2] It doesn’t include four of the ten largest companies in the U.S: Amazon, Alphabet (Google), Facebook, and Berkshire Hathaway.
It is also important to note that some investors may be concerned about other asset classes besides stocks. Depending on investor objectives, a diversified portfolio may include a mix of global stocks, bonds, commodities, and alternative assets not represented in a stock index. A portfolio’s performance should always be evaluated within the context of an investor’s specific goals. Understanding how a personal portfolio compares to broadly published indices like the Dow can give investors context about how headlines apply to their own situation.
Conclusion
News headlines are often written to grab attention. A headline publicizing a 500-point move in the Dow may trigger an emotional response and, depending on the direction, sound either exciting or ominous enough to warrant reading the article. However, a 500-point move isn’t what it used to be in percentage terms. After digging further, we can see that the insights such headlines offer may be limited, especially if investors hold portfolios designed and managed daily to meet their individual goals, needs, and preferences.
1]. 500 companies are included in the S&P 500 Index. However, because some of these companies have multiple classes of stock that meet the requirements for inclusion, the total number of stocks tracked by the index is 505.
[2]. Market cap data as of January 31, 2019.
[3]. Market capitalization is the product of price and shares outstanding.
Company News
Market Commentary
Retirement Planning
Tax Planning
Cyber Security
Important Disclosures
Leonard Rickey Investment Advisors, PLLC (“LRIA”), is an SEC registered investment adviser located in the State of Washington. Registration does not imply a certain level of skill or training. For information pertaining to the registration status of LRIA, please contact LRIA or refer to the Investment Adviser Public Disclosure website (www.adviserinfo.sec.gov).
This is provided for general information only and contains information that is not suitable for everyone. As such, nothing herein should be construed as the provision of specific investment advice or recommendations for any individual. To determine which investments may be appropriate for you, consult your financial advisor prior to investing. There is no guarantee that the views and opinions expressed herein will come to pass. This newsletter contains information derived from third party sources. Although we believe these third-party sources to be reliable, we make no representations as to the accuracy or completeness of any information prepared by any unaffiliated third party incorporated herein and take no responsibility therefore.
Any projections, forecasts and estimates, including without limitation any statement using “expect” or “believe” or any variation of either term or a similar term, contained here are forward-looking statements and are based upon certain current assumptions, beliefs and expectations that LRIA considers reasonable or that the applicable third parties have identified as such. Forward-looking statements are necessarily speculative in nature, and it can be expected that some or all of the assumptions or beliefs underlying the forward-looking statements will not materialize or will vary significantly from actual results or outcomes. Some important factors that could cause actual results or outcomes to differ materially from those in any forward-looking statements include, among others, changes in interest rates and general economic conditions in the U.S. and globally, changes in the liquidity available in the market, change and volatility in the value of the U.S. dollar, market volatility and distressed credit markets, and other market, financial or legal uncertainties. Consequently, the inclusion of forward-looking statements herein should not be regarded as a representation by LRIA or any other person or entity of the outcomes or results that will be achieved by following any recommendations contained herein. While the forward-looking statements here reflect estimates, expectations and beliefs, they are not guarantees of future performance or outcomes. LRIA has no obligation to update or otherwise revise any forward-looking statements, including any revisions to reflect changes in economic conditions or other circumstances arising after the date hereof or to reflect the occurrence of events (whether anticipated or unanticipated), even if the underlying assumptions do not come to fruition. Opinions expressed herein are subject to change without notice and do not necessarily take into account the particular investment objectives, financial situations, or particular needs of all investors.
For additional information about LRIA, including fees and services, please contact us for our Form ADV disclosure brochure using our contact information herein. Please read the disclosure brochure carefully before you invest or send money.
2026 1st Quarter Investment Commentary