Apr 13, 2021 Market Analysis
Market Analysis
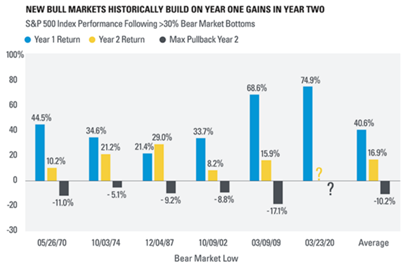
March marked the first anniversary of the bottom of the COVID bear market for the S&P 500 Index. Despite the turbulence of the past year, investors were rewarded by sticking with stocks. No one could have predicted this, but the S&P 500 completed its greatest one-year rally post-WWII, gaining over 74% from March 23, 2020, to March 23, 2021 (3).
Given the strong recovery in stock prices, we wouldn’t be surprised to see a correction. Indeed, the data show that following bear markets, the average correction in year 2 of the recovery has been 10%. However, it is essential to remember that we are still only one year into the market and economic recovery. The second year of a bull market has still historically provided solid returns for stock investors. The previous five bull markets all saw gains during their second year (4).
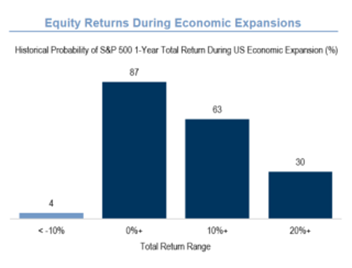
The economic backdrop looked supportive of stocks. The Bloomberg monthly survey of economists showed consensus U.S. economic growth expectations to be 5.7%, the highest in decades (5). During U.S. economic expansions, the S&P 500 has been positive 87% of the time (6).
Additionally, corporate earnings have recovered substantially since the pandemic lows, and expectations were for record profits in 2021 and 2022. However, it should be noted that corporate taxes may increase, potentially dampening profits.
Of course, there are also risks, including signs of investor exuberance and high U.S. stock valuations. For example, U.S. equity market valuations were at the very high end of historical ranges. For example, the S&P 500 was trading at 22x forward earnings and over 36x the average of its previous 10 years of earnings, levels that in the past have suggested modest returns on a long-term view. Also, high yield bonds were at their lowest yields in the last 20 years, signaling investors’ willingness to take more risk.
There was also a general sense of bullishness regarding prospects for stock returns. February saw the highest ever inflows into stock mutual funds and ETFs (7). There has been a boom in special purpose acquisition vehicles (SPACs) and aggressive retail investor activity in the U.S. Initial Public Offerings (IPO) were on pace to more than triple from last year. This is remarkable because 2020 saw the highest number of IPOs since 1999. Through March 31, 2021, there have been 402 IPOs on the U.S. stock market compared to 480 for all 2020 (8).
Overall, we are still positive on stocks due to the positive economic backdrop, increased corporate profits, and continued support from fiscal and monetary policy.
Please reach out to your advisor if you have any questions or concerns.
[3]S&P Down Jones Indices. Based on rolling 1-year percentage changes in the S&P 500.
[4]LPL Research
[5]Bloomberg
[6]Goldman Sachs Research
[7]Blackrock, data from 2/1993-2/2021
[8]Stockanalysis.com
INDEX DEFINITIONS
The Barclays Aggregate Bond Index represents securities that are SEC-registered, taxable, and dollar denominated. The index covers the US investment-grade fixed rate bond market, with index components for government and corporate securities, mortgage pass-through securities, and asset-backed securities.
The Standard & Poor’s 500 Index is a capitalization-weighted index of 500 stocks designed to measure performance of the broad domestic economy through changes in the aggregate market value of 500 stocks representing all major industries. It cannot be invested into directly.
The Russell 2000 Index is an unmanaged index generally representative of the 2,000 smallest companies in the Russell Index, which represents approximately 10% of the total market capitalization of the Russell 3000 Index.
The MSCI Emerging Markets Index is a float-adjusted market capitalization index that consists of indices of approximately 800 stocks and is designed to measure equity market performance in 23 emerging economies: Brazil, Chile, China, Colombia, Czech Republic, Egypt, Greece, Hungary, India, Indonesia, Korea, Malaysia, Mexico, , Peru, Philippines, Poland, Qatar, Russia, South Africa, Taiwan, Thailand, Turkey, and the United Arab Emirates.
The MSCI EAFE (Europe, Australasia, Far East) Index is a free float-adjusted market capitalization index of approximately 900 stocks and is designed to measure equity market performance in 21 developed market countries outside of North America.
The SG Trend Index is a subset of the SG CTA Index, and follows traders of trend following methodologies. The SG CTA Index is equal weighted, calculates the daily rate of return for a pool of CTAs selected from the larger managers that are open to new investment.
Swiss Re Global Cat Bond Index tracks the aggregate performance of all catastrophe bonds issued offered under Rule 144A. The index captures bonds denominated in any currency, all rated and unrated cat bonds, outstanding perils, and triggers. The index is not exposed to currency risk from non-USD denominated cat bonds.
The Dow Jones Industrial Average® (The Dow®), is a price-weighted measure of 30 U.S. blue-chip companies. The index covers all industries except transportation and utilities.
The Dow Jones Transportation Average is a 20-stock, price-weighted index that represents the stock performance of large, well-known U.S. companies within the transportation industry.
Company News
Market Commentary
Retirement Planning
Tax Planning
Cyber Security
Important Disclosures
Leonard Rickey Investment Advisors, PLLC (“LRIA”), is an SEC registered investment adviser located in the State of Washington. Registration does not imply a certain level of skill or training. For information pertaining to the registration status of LRIA, please contact LRIA or refer to the Investment Adviser Public Disclosure website (www.adviserinfo.sec.gov).
This is provided for general information only and contains information that is not suitable for everyone. As such, nothing herein should be construed as the provision of specific investment advice or recommendations for any individual. To determine which investments may be appropriate for you, consult your financial advisor prior to investing. There is no guarantee that the views and opinions expressed herein will come to pass. This newsletter contains information derived from third party sources. Although we believe these third-party sources to be reliable, we make no representations as to the accuracy or completeness of any information prepared by any unaffiliated third party incorporated herein and take no responsibility therefore.
Any projections, forecasts and estimates, including without limitation any statement using “expect” or “believe” or any variation of either term or a similar term, contained here are forward-looking statements and are based upon certain current assumptions, beliefs and expectations that LRIA considers reasonable or that the applicable third parties have identified as such. Forward-looking statements are necessarily speculative in nature, and it can be expected that some or all of the assumptions or beliefs underlying the forward-looking statements will not materialize or will vary significantly from actual results or outcomes. Some important factors that could cause actual results or outcomes to differ materially from those in any forward-looking statements include, among others, changes in interest rates and general economic conditions in the U.S. and globally, changes in the liquidity available in the market, change and volatility in the value of the U.S. dollar, market volatility and distressed credit markets, and other market, financial or legal uncertainties. Consequently, the inclusion of forward-looking statements herein should not be regarded as a representation by LRIA or any other person or entity of the outcomes or results that will be achieved by following any recommendations contained herein. While the forward-looking statements here reflect estimates, expectations and beliefs, they are not guarantees of future performance or outcomes. LRIA has no obligation to update or otherwise revise any forward-looking statements, including any revisions to reflect changes in economic conditions or other circumstances arising after the date hereof or to reflect the occurrence of events (whether anticipated or unanticipated), even if the underlying assumptions do not come to fruition. Opinions expressed herein are subject to change without notice and do not necessarily take into account the particular investment objectives, financial situations, or particular needs of all investors.
For additional information about LRIA, including fees and services, please contact us for our Form ADV disclosure brochure using our contact information herein. Please read the disclosure brochure carefully before you invest or send money.
2026 1st Quarter Investment Commentary