Apr 15, 2025 2025 1st Quarter Investment Commentary
-
Uncertainty around tariffs sent the S&P 500 down more than 4% in the 1st quarter
-
Technology stocks posted their worst quarter since 2020, while non-US stocks, value stocks, and defensive sectors led other sectors. Bonds also provided safety.
-
On April 2nd, US tariffs were announced that exceeded investor expectations. This led to a market decline and increased short-term volatility. While the full economic impact remains uncertain, we are monitoring indicators that may suggest rising economic headwinds.
1st Quarter Market and Economic Summary
The first quarter of 2025 marked a reversal for U.S. equities, as optimism gave way to uncertainty. After US stocks, as measured by the S&P 500 TR Index, hit all-time highs in February, investors became unsettled by China’s DeepSeek potentially disrupting AI and policy uncertainty around tariffs. Potential US trade policies changed the market conversation from a focus on a “soft landing” for the economy and Federal Reserve interest-rate cuts to worries about tariffs reviving upward pressure on inflation, declining consumer confidence, and rising odds of a recession. The S&P 500 fell 4%, while the tech-heavy Russell 1000 Growth tumbled 10%, largely erasing gains from the post-election rally.
The large technology stocks that propelled the U.S. market to its highest back-to-back annual returns since the nineties were hit hard during the quarter as their lofty valuations deflated. The so-called Magnificent Seven had their worst quarter on record, underscoring the importance of diversification.
On the positive side, a diversified portfolio worked well during the quarter. Seven of the eleven S&P sectors posted positive returns, with defensive sectors like healthcare and consumer staples emerging as leaders. In addition, Value stocks, non-US stocks, bonds and gold all posted positive performance.
Uncertainty surrounding trade policy was a major driver of volatility. Analysts revised economic growth expectations downward while elevating inflation forecasts. Firms hesitated to commit to capital spending and hiring and survey data from consumers and businesses fell dramatically.
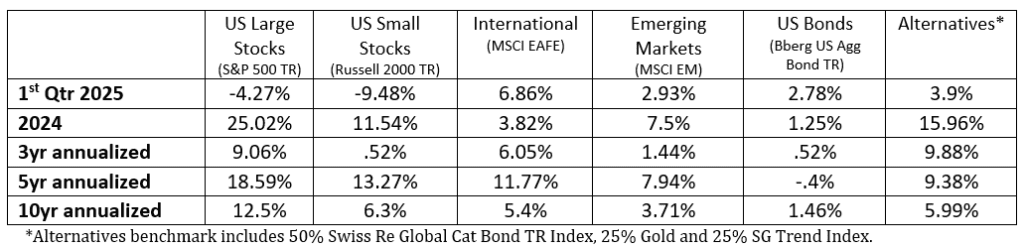
However, the hard data continued to hold up. Job creation slowed slightly but the labor market remained strong. U.S. corporate earnings expectations and high-frequency indicators of consumer health, like weekly credit card spending, were also solid. Yet near-term risks to growth loomed. Caution around spending has been a significant theme on corporate earnings calls, with many companies lowering their forecasts and expressing uncertainty about how policy will affect them. The uncertainty seemed likely to hit consumer spending, investment, and trade. Below is a summary of benchmark returns (1).
Update as of 4/5/2025
The past few days have brought significant developments in global trade and financial markets, which we want to address with you. As always, we aim to provide clarity and reassurance during uncertain times.
April 2nd, the US administration introduced a universal 10% tariff on all imports, with higher “reciprocal” tariffs targeting specific countries. The stated goal is to use tariffs to help bring manufacturing back to the U.S. and address trade imbalances between the U.S. and the rest of the world. These changes impacted markets, especially major companies heavily reliant on international supply chains.
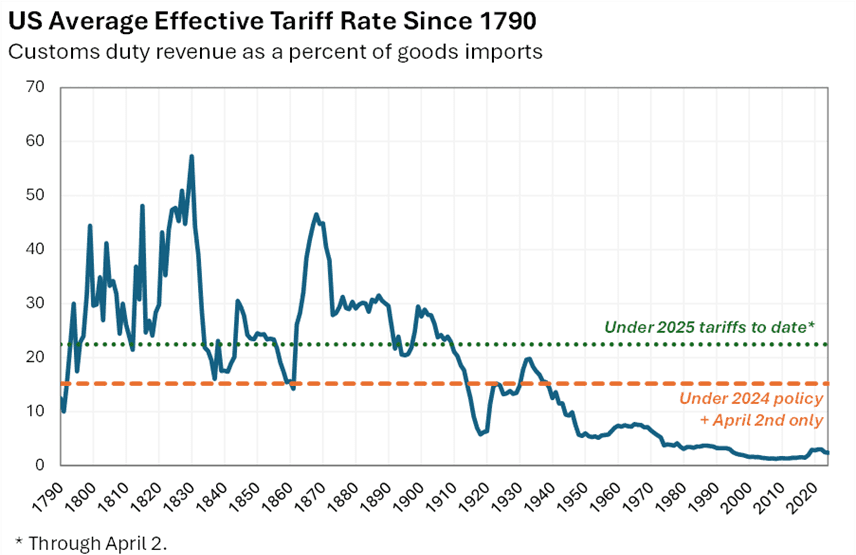
The scope of the tariffs is significant and marks the largest escalation for U.S. tariffs in the postwar era. In addition, the tariff rate is much higher than consensus expectations had assumed and is disproportionately hitting the largest U.S. trading partners. The combined April 2nd tariffs with other already established tariffs are estimated to increase the effective rate to 22.5%, according to Yale’s “The Budget Lab” analysis (see chart) (2). Analysts are increasingly concerned about the potential for recession and higher inflation over the next 12 months, but the situation remains fluid.
There is still considerable uncertainty about tariffs’ impact and true intent. The broad rollout could be a starting point for negotiations or intended to be long-term. There is also a lack of clarity on the duration, who absorbs them (exporter, importer, consumer), and the ramifications on corporate earnings and the economy.
The impact on economic growth, corporate earnings, and inflation depends on how the “who will pay” breakdown plays out. For example, if companies pay some of the costs, it could reduce profit margins and lead to layoffs and slower economic growth. However, if consumers pay more for imported items, that may result in a higher inflation rate. Also, consumer behavior may lead to the consumption of alternative products not affected by tariffs—or they may seek out substitute products or altogether defer the consumption of a particular product.
U.S. tariffs are slated to go into effect on April 9th. Countries will respond and negotiate between today and then, and there will still be considerable uncertainty regarding where the tariffs ultimately land. As other countries retaliate, we could see the tariffs dialed up even more. The economic impact of these potential changes for the U.S. economy could be large and market volatility is likely to remain elevated.
What to do now?
Markets have experienced broad declines across sectors, with notable volatility in equity indices. According to data obtained from KoyFin, since reaching record highs on February 19 through April 4th, the S&P 500 has declined by over 17%, while the Dow is down 14%. The tech-heavy Nasdaq and small-cap Russell 2000 have been hit the hardest, with losses of 22.3% and 19.9%, respectively. The drawdowns are in correction territory, but nothing about today’s price action feels garden variety. Some corrections reverse quickly, while others keep going and become bear markets.
On the positive side, other parts of the global markets are holding up much better year to date. Positions in bonds (Barclays Aggregate Bond Index), non-US stocks (MSCI EAFE Index), and gold have helped a diversified portfolio.
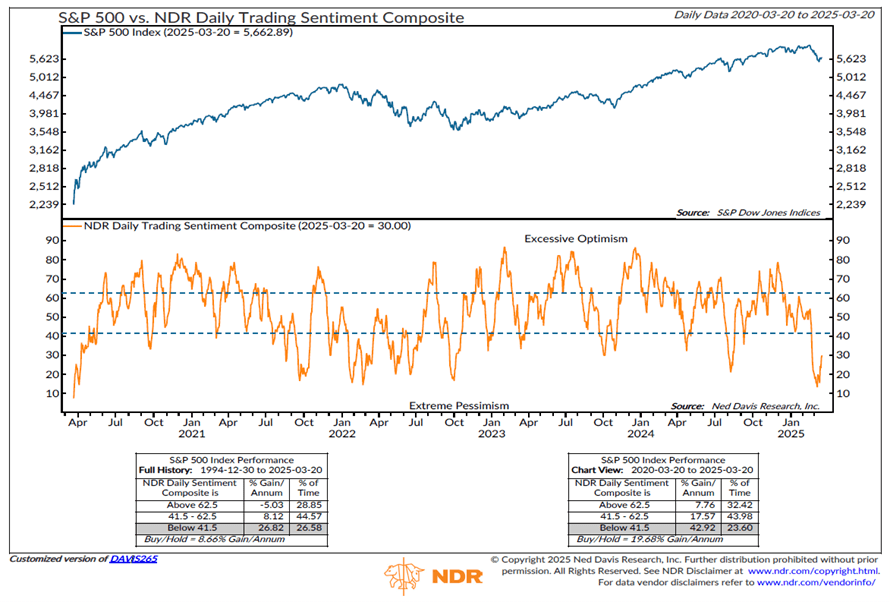
In addition, sentiment is very bearish, which could mean much of the bad news is priced in. For example, Ned Davis Research publishes a Sentiment composite consisting of survey and positioning data, and it shows sentiment near the lows of 2022 (3). Sentiment can be a contrarian indicator, and extreme pessimism can be linked to oversold conditions.
Our technical indicators have significantly deteriorated, and some models indicate rising recession probabilities, although outcomes remain uncertain. All major U.S. indexes broke below key support levels marked by their March 13th lows. In addition, valuations are not cheap by historical standards. A recession would likely take stock prices down where valuations are more compelling. Further, the unprecedented nature and size of the tariffs make it difficult to assess their potential effects on markets. Some economists estimate an impact of up to 2% of GDP. This uncertainty will not likely go away soon, and we expect volatility to remain high.
Our allocation recommendations stem from the use of the money. If you plan on using your funds, we recommend holding more in bonds or money market. A more conservative allocation can give you more time before needing to sell equities. More conservative allocations may see risk reductions if volatility remains high. On the flip side, if you are not using your funds for current income, we may look at averaging into equity holdings at much lower prices than the end of last year. At times like these, we reflect on the Rudyard Kipling quote made popular by Warren Buffet
“If you can keep your head when all about you are losing theirs … If you can wait and not be tired by waiting … If you can think — and not make thoughts your aim … If you can trust yourself when all men doubt you … Yours is the Earth and everything that’s in it.”
As always, please contact your advisor if you have any questions or want to revisit your risk profile.
Footnotes:
1 – Morningstar Direct and Factset , as of 3/31/2025
2 – Historical Statistics of the United States Ea424-434, Monthly Treasury Statement, Bureau of Economic Analysis, The Budget Lab analysis
3 – Ned Davis Research, as of 3.20.25
INDEX DEFINITIONS
The Barclays Aggregate Bond Index represents securities that are SEC-registered, taxable, and dollar denominated. The index covers the US investment-grade fixed rate bond market, with index components for government and corporate securities, mortgage pass-through securities, and asset-backed securities.
The Standard & Poor’s 500 Index is a capitalization-weighted index of 500 stocks designed to measure performance of the broad domestic economy through changes in the aggregate market value of 500 stocks representing all major industries. It cannot be invested into directly.
The Russell 2000 Index is an unmanaged index generally representative of the 2,000 smallest companies in the Russell Index, which represents approximately 10% of the total market capitalization of the Russell 3000 Index.
The MSCI Emerging Markets Index is a float-adjusted market capitalization index that consists of indices of approximately 800 stocks and is designed to measure equity market performance in 23 emerging economies: Brazil, Chile, China, Colombia, Czech Republic, Egypt, Greece, Hungary, India, Indonesia, Korea, Malaysia, Mexico, , Peru, Philippines, Poland, Qatar, Russia, South Africa, Taiwan, Thailand, Turkey, and the United Arab Emirates.
The MSCI EAFE (Europe, Australasia, Far East) Index is a free float-adjusted market capitalization index of approximately 900 stocks and is designed to measure equity market performance in 21 developed market countries outside of North America.
The SG Trend Index is a subset of the SG CTA Index and follows traders of trend following methodologies. The SG CTA Index is equal weighted, calculates the daily rate of return for a pool of CTAs selected from the larger managers that are open to new investment.
Swiss Re Global Cat Bond Index tracks the aggregate performance of all catastrophe bonds issued offered under Rule 144A. The index captures bonds denominated in any currency, all rated and unrated cat bonds, outstanding perils, and triggers. The index is not exposed to currency risk from non-USD denominated cat bonds.
DJ Commodity Gold TR Index is a financial index that tracks the performance of gold futures contracts. It’s a way to measure the price changes of gold investments without actually owning the physical metal.
Company News
Market Commentary
Retirement Planning
Tax Planning
Cyber Security
Important Disclosures
Leonard Rickey Investment Advisors, PLLC (“LRIA”), is an SEC registered investment adviser located in the State of Washington. Registration does not imply a certain level of skill or training. For information pertaining to the registration status of LRIA, please contact LRIA or refer to the Investment Adviser Public Disclosure website (www.adviserinfo.sec.gov).
This is provided for general information only and contains information that is not suitable for everyone. As such, nothing herein should be construed as the provision of specific investment advice or recommendations for any individual. To determine which investments may be appropriate for you, consult your financial advisor prior to investing. There is no guarantee that the views and opinions expressed herein will come to pass. This newsletter contains information derived from third party sources. Although we believe these third-party sources to be reliable, we make no representations as to the accuracy or completeness of any information prepared by any unaffiliated third party incorporated herein and take no responsibility therefore.
Any projections, forecasts and estimates, including without limitation any statement using “expect” or “believe” or any variation of either term or a similar term, contained here are forward-looking statements and are based upon certain current assumptions, beliefs and expectations that LRIA considers reasonable or that the applicable third parties have identified as such. Forward-looking statements are necessarily speculative in nature, and it can be expected that some or all of the assumptions or beliefs underlying the forward-looking statements will not materialize or will vary significantly from actual results or outcomes. Some important factors that could cause actual results or outcomes to differ materially from those in any forward-looking statements include, among others, changes in interest rates and general economic conditions in the U.S. and globally, changes in the liquidity available in the market, change and volatility in the value of the U.S. dollar, market volatility and distressed credit markets, and other market, financial or legal uncertainties. Consequently, the inclusion of forward-looking statements herein should not be regarded as a representation by LRIA or any other person or entity of the outcomes or results that will be achieved by following any recommendations contained herein. While the forward-looking statements here reflect estimates, expectations and beliefs, they are not guarantees of future performance or outcomes. LRIA has no obligation to update or otherwise revise any forward-looking statements, including any revisions to reflect changes in economic conditions or other circumstances arising after the date hereof or to reflect the occurrence of events (whether anticipated or unanticipated), even if the underlying assumptions do not come to fruition. Opinions expressed herein are subject to change without notice and do not necessarily take into account the particular investment objectives, financial situations, or particular needs of all investors.
For additional information about LRIA, including fees and services, please contact us for our Form ADV disclosure brochure using our contact information herein. Please read the disclosure brochure carefully before you invest or send money.
2026 1st Quarter Investment Commentary