Jan 19, 2018 4th Quarter 2017 Commentary
Market Summary
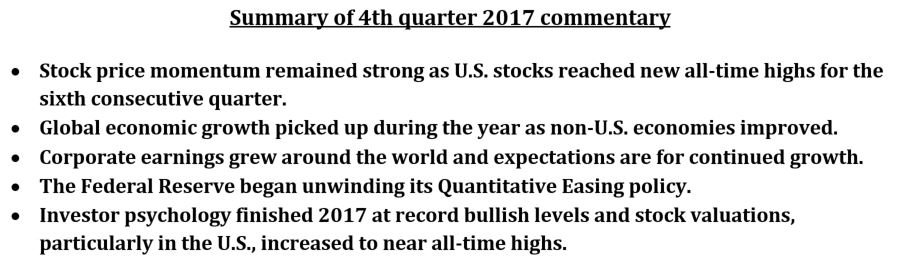
A strong economy, better earnings and pro-business policies helped push U.S. stocks to record high prices with record low volatility. U.S. stocks, as measured by the S&P 500, reached new all-time highs for the sixth consecutive quarter and were higher for the 9th consecutive year, making it the second longest bull market in history[1]. For the first time ever, the S&P 500 posted total return gains in all 12 months during the year and it has been up 14 months in a row (second longest on record). In addition, there was not a single 3% pullback and there were only eight 1% daily changes during the year[2]. 2017 was one of the least volatile years for the S&P 500 in history.
Stock market breadth remained healthy and momentum remained strong. The S&P 500’s strong performance was spread across most sectors. Only two sectors (Telecom and Energy) were down on the year. Strong market performance was also spread amongst most countries. 45 out of 47 countries in the MSCI All Country World Index posted positive returns[3]. Growth stocks beat value stocks[4], large cap beat small cap and non-U.S. stocks beat U.S. stocks for the year. Bond returns significantly underperformed stock returns; however, they did finish the year in the positive.
The global economy experienced synchronized growth in 2017. All 45 countries tracked by the Organization for Economic Cooperation and Development (OECD) grew in 2017[5]. In the U.S., The Tax Cuts and Jobs Act, substantially reduced corporate taxes and marginally reduced taxes for many individuals. Most economists believe it will have a slightly positive impact on U.S. economic growth and a strong impact on U.S. corporate earnings. With strong market returns and business friendly policies, optimism was prevalent amongst consumers, businesses and investors. Below is a summary of returns for the major indexes[6]
| US Large Stocks(S&P 500 TR) | US Small Stocks (Russell 2000 TR) | International (MSCI EAFE) | Emerging Markets (MSCI EM) | US Bonds (Barclays US Agg Bond TR) | |
| 4th Quarter 2017* | 6.64% | 3.34% | 4.23% | 7.44% | .39% |
| 2017 | 21.83% | 14.65% | 25.03% | 37.28% | 3.54% |
| 3yr annualized* | 11.41% | 9.96% | 7.8% | 9.1% | 2.24% |
| 5yr annualized* | 15.79% | 14.12% | 7.9% | 4.35% | 2.1% |
| 10yr annualized* | 8.5% | 8.71% | 1.94% | 1.68% | 4.01% |
Economic Update
Nearly all measure of economic growth and activity remained positive in the fourth quarter and in 2017. As measured by Gross Domestic Product (GDP), the U.S. economy grew at nearly 2.5% for the year and reached 102 months of economic expansion (the 3rd longest in history)[7]. The recent tax reform is estimated to reduce taxes for the average consumer (not to mention corporations), which may increase consumer spending. Consumer spending accounts for nearly 70% of U.S. GDP so many economists are forecasting an increase to economic growth in 2018. The unemployment rate fell to 4.1%, a 17-year low[8], consumer and corporate balance sheets were healthy, the housing market continued to gain strength and inflation remained modest.
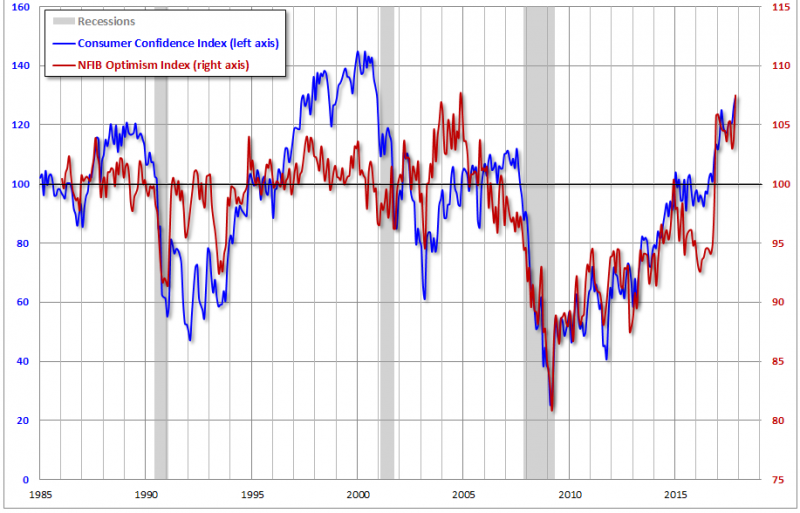
All this good news affected both consumer and business psychology. Consumer confidence (blue line, as measured by the Conference Board Consumer Confidence Index) finished at its highest level since 2000 and business optimism (red line, as measured by the National Federation of Independent Business) nearly reached its record high set in 2004[9].
Non-U.S. economic growth picked up significantly during the year. While the U.S. has enjoyed nine years of economic growth, the rest of the world has lagged and as a result, may have further room to run. Europe enjoyed a remarkable recovery in 2017, driven by a combination of central bank stimulus, ultra-low interest rates (negative in some countries) and improving growth. Third-quarter GDP in the 19-member euro zone grew at an annualized rate of 2.5%, and the unemployment rate fell to 8.9%, its lowest level since 2009[10]. The political picture also stabilized, as continental Europe has essentially lined up in support of the European Union.
Interest Rates
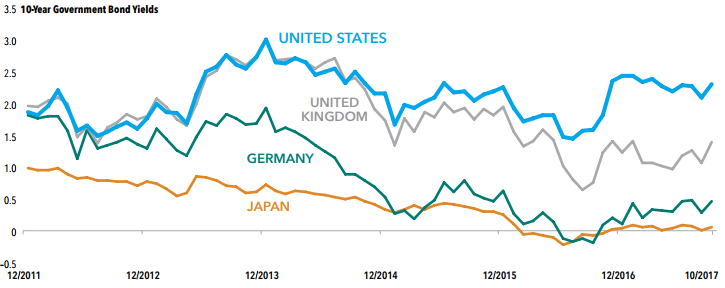
The Federal Reserve increased short term rates three times in 2017 from .75% to 1.5%. While this increased short term rates, longer term rates weren’t significantly affected. For example, rates on U.S. 10-year Treasury notes remained low and actually decreased from 2.45% to 2.4% during the year[11]. Many factors have kept yields low, such as modest economic growth, low inflation and Central Bank policy of buying bonds (knows as Quantitative Easing). Despite these relatively low levels, U.S. interest rates remained higher than many other developed markets, partly because the U.S. economy has sustained a significantly higher growth rate[12] (see chart below).
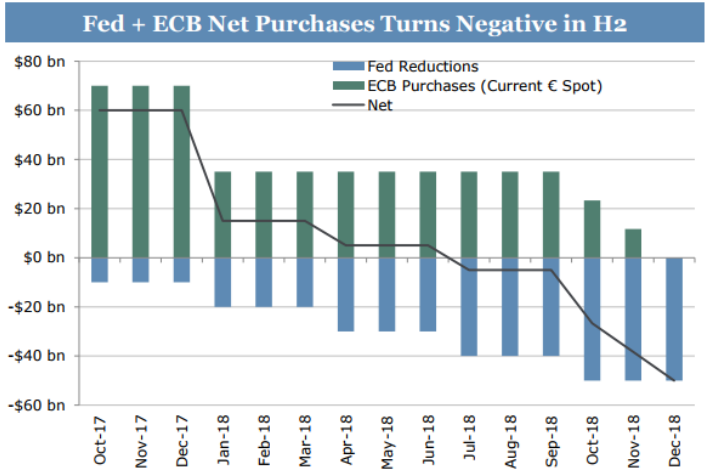
As part of Central Banks’ response to the financial crisis and economic slowdown in 2008 and 2009, they expanded their balance sheets by buying bonds. The central banks became the largest buyers of bonds and other securities as a way of increasing money supply, lowering borrowing costs and improving economic recovery. This held interest rates down and in turn, led many investors into riskier assets (such as stocks and high yield bonds) in order to earn a return above inflation. But with the U.S. economy back on its feet, the Federal Reserve decided that this emergency measure was no longer needed. Instead of buying bonds, the Fed began shrinking its balance sheet in October (see blue bar below). In addition, the European Central Bank signaled it will begin to trim its purchases of securities starting in January 2018 and stop all together in December 2018 (see green bar below)[13]. This was a significant policy shift from the previous eight years. We do not know the effect that this will have on stock or bond prices but generally a more restrictive monetary policy isn’t a positive for riskier assets like stocks and it is something we will have our eye on in 2018.
Sentiment
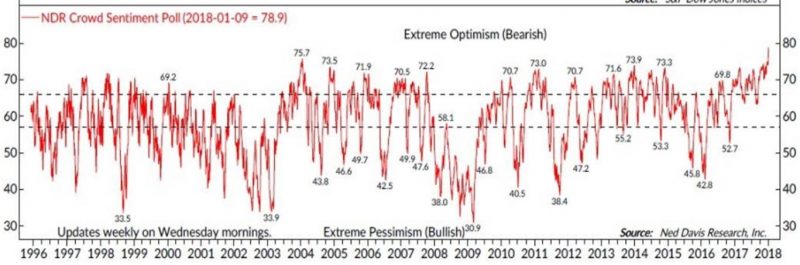
Tax cuts, a strong economy and daily stock market records not only pushed consumer and business sentiment to near record highs, but they also lifted investor sentiment to levels not seen in two decades. Ned Davis Research (NDR) combines seven different sentiment gauges into an overall sentiment indicator that highlights the current mood of investors (see chart below[14]). As of January 9, 2018, overall investor sentiment was at its highest level since 1995.
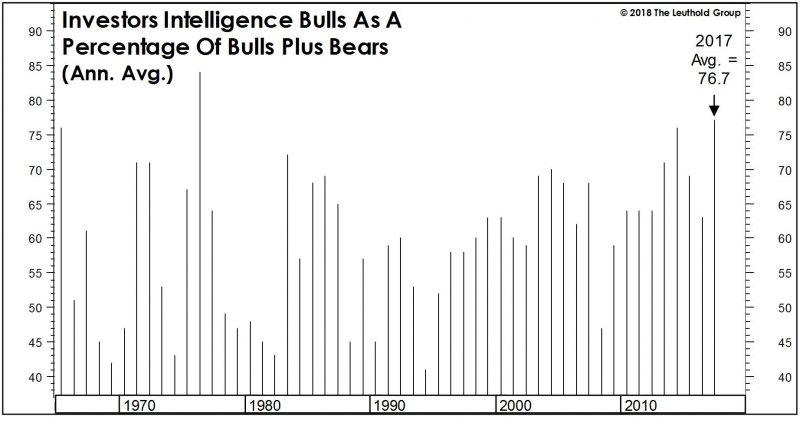
In addition, the Investors Intelligence Sentiment Survey, which tracks the opinions of about 130 market newsletter writers, posted the second-highest annual average percentage of stock market bulls in its 54-year history[15].
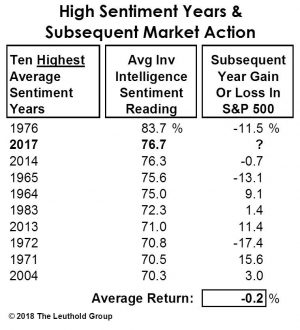
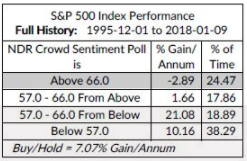
The tables below show that high sentiment readings generally lead to lower stock market returns[16]. The Investors Intelligent Survey (table below left) shows that when it has been above 70, the subsequent year returns on the S&P 500 have averaged -.2%. In addition, the NDR sentiment indicator (table below right) shows that for readings above 66 (it is currently at 78.9) the annualized return on the S&P 500 has averaged -2.89%. I want to stress that these are averages and not predictions of what will happen in 2018.
Corporate Earnings
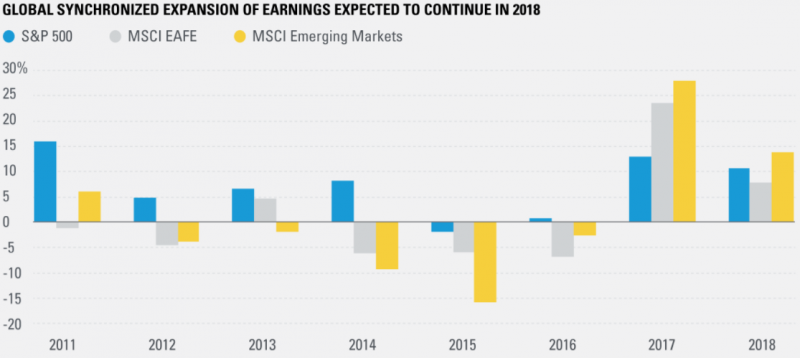
After two years of negative to flat earnings growth, U.S. corporate earnings rebounded in 2017. Perhaps more importantly, non-U.S. Developed market earnings (as measured by the MSCI EAFE index) grew for the first time since 2013 and Emerging Market earnings grew for the first time since 2011. Earnings growth in non-U.S. companies accelerated faster than U.S. earnings for the first time since 2010 and was a major factor in non-U.S. stocks outperforming U.S. stocks in 2017. Continuing with the theme of global synchronized growth, this was the first time since 2010 when U.S., non-U.S. Developed and Emerging Market corporate earnings all had positive growth[17]. Consensus analyst expectations were for continued growth into 2018.
The major change in corporate earnings during the quarter was the reduction in the U.S. corporate tax rate from 35% to 21%. As Warren Buffett explained “That’s a huge, huge reduction. If you and I were partners in a business and you owned 35% of it and I own 65% and then you showed up one day and said I’m giving you 14 of my 35 points, now my interest has gone from 65% to 79%. That’s more than a 20% increase in the earning power, and you’ve just given it to me. Nothing has changed in the business. That’s a big factor.”[18]
Valuations
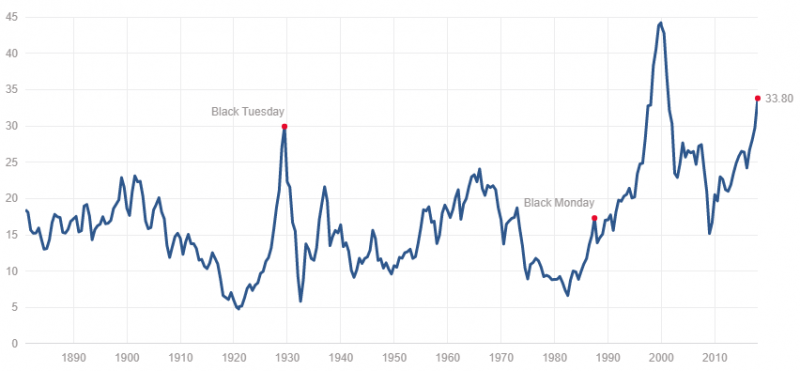
U.S. valuations, as measured by the Shiller PE ratio, remained high at the end of the year. By some measures, U.S. stock valuations are at their highest ever outside of the tech boom of the late 1990’s and even higher than 1929, the year before the Great Depression (see chart below)[19].
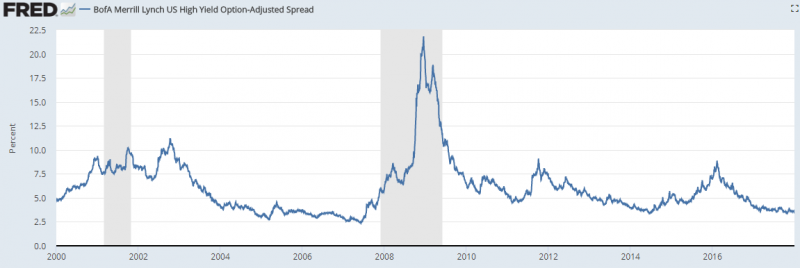
Stocks weren’t the only expensive asset class by the end of 2017. Corporate and high-yield bonds finished 2017 at expensive levels as well. The chart below shows the spread between a corporate high yield index and a Treasury bond index with similar maturities. A low spread (like we have today) means the perceived risk of investing in high yield bonds is low. 2017 finished with the lowest spread since 2007, meaning that investors were not pricing in very much risk in high yield bonds. Compare the current rate to 2002 or 2009 when spreads increased significantly[20].
The overall market trend remained favorable, the corporate earnings outlook improved with U.S. tax cuts and positive non-U.S. earnings and the global economic expansion accelerated in 2017. However, with high investor sentiment, high stock valuations, and a change in Federal Reserve monetary policy, caution may be warranted.
As always, please call if you have any questions or would like to discuss in more detail.
[1] JPMorgan, Guide to the Markets 1st Qtr 2018
[2] LPL Financial Research
[3] Dimensional Fund Advisors
[4] As measured by S&P 500 Growth Index and S&P 500 Value Index
[5] Sellwood Consulting
[6] Morningstar Direct. As of 1/2/2018
[7] JPMorgan, Guide to the Markets 1st Qtr 2018
[8] Federal Reserve Economic Data
[9] Advisor Perspectives, 12/27/17
[10] Capital Group
[11] U.S. Department of the Treasury
[12] Capital Group
[13] DoubleLine Capital
[14] Ned Davis Research
[15] Leuthold Group
[16] Leuthold Group. Ned Davis Research
[17] LPL Research, Bloomberg
[18] CNBC, “Squawk Box”, January 10, 2018
[19] Shiller PE ratio. Price earnings ratio is based on average S&P 500 inflation-adjusted earnings from the previous 10 years
[20] Federal Reserve Economic Data. BofA Merrill Lynch US High Yield Option-Adjusted Spread
IMPORTANT DISCLOSURES
Leonard Rickey Investment Advisors, PLLC (“LRIA”), is an SEC registered investment adviser located in the State of Washington. Registration does not imply a certain level of skill or training. For information pertaining to the registration status of LRIA, please contact LRIA or refer to the Investment Adviser Public Disclosure website (www.adviserinfo.sec.gov).
This newsletter is provided for general information only and contains information that is not suitable for everyone. As such, nothing herein should be construed as the provision of specific investment advice or recommendations for any individual. To determine which investments may be appropriate for you, consult your financial advisor prior to investing. All performance referenced herein is historical in nature and is not an indication of or a guarantee of future results. All indices are unmanaged and cannot be invested into directly. Unmanaged index returns do not reflect fees, expenses, or sales charges. Index performance is not indicative of the performance of any investment.
Your experience may vary according to your individual circumstances and there can be no assurance that LRIA will be able to achieve similar results for all clients in comparable situations or that any particular strategy or investment will prove profitable. As investment returns, inflation, taxes and other economic conditions vary, your actual results may vary significantly. There is no guarantee that the views and opinions expressed herein will come to pass. This newsletter contains information derived from third party sources. Although we believe these third party sources to be reliable, we make no representations as to the accuracy or completeness of any information prepared by any unaffiliated third party incorporated herein, and take no responsibility therefore.
Stock investing includes numerous specific risks including the fluctuations of dividend, loss of principal, and potential illiquidity of the investment in a falling market. International and emerging markets investing involves special risks such as currency fluctuation and political instability and may not be suitable for all investors. Small cap stocks may be subject to a higher degree of risk than more established companies’ securities. The illiquidity of the small cap market may adversely affect the value of these investments. Information presented herein is subject to change without notice and should not be considered as a solicitation to buy or sell any security. This newsletter should not be regarded as a complete analysis of the subjects discussed.
Any projections, forecasts and estimates, including without limitation any statement using “expect” or “believe” or any variation of either term or a similar term, contained here are forward-looking statements and are based upon certain current assumptions, beliefs and expectations that LRIA considers reasonable or that the applicable third parties have identified as such. Forward-looking statements are necessarily speculative in nature, and it can be expected that some or all of the assumptions or beliefs underlying the forward-looking statements will not materialize or will vary significantly from actual results or outcomes. Some important factors that could cause actual results or outcomes to differ materially from those in any forward-looking statements include, among others, changes in interest rates and general economic conditions in the U.S. and globally, changes in the liquidity available in the market, change and volatility in the value of the U.S. dollar, market volatility and distressed credit markets, and other market, financial or legal uncertainties. Consequently, the inclusion of forward-looking statements herein should not be regarded as a representation by LRIA or any other person or entity of the outcomes or results that will be achieved by following any recommendations contained herein. While the forward-looking statements here reflect estimates, expectations and beliefs, they are not guarantees of future performance or outcomes. LRIA has no obligation to update or otherwise revise any forward-looking statements, including any revisions to reflect changes in economic conditions or other circumstances arising after the date hereof or to reflect the occurrence of events (whether anticipated or unanticipated), even if the underlying assumptions do not come to fruition. Opinions expressed herein are subject to change without notice and do not necessarily take into account the particular investment objectives, financial situations, or particular needs of all investors.
The fast price swings in commodities and currencies can result in significant volatility in an investor’s holdings.
There is no assurance that the techniques and strategies discussed are suitable for all investors or will yield positive outcomes. The
Value investments can perform differently from the market as a whole. They can remain undervalued by the market for long periods of time.
The economic forecasts set forth in the presentation may not develop as predicted and there can be no guarantee that strategies promoted will be successful.
For additional information about LRIA, including fees and services, please contact us for our Form ADV disclosure brochure using our contact information herein. Please read the disclosure brochure carefully before you invest or send money.
INDEX DEFINITIONS
The Barclays Aggregate Bond Index represents securities that are SEC-registered, taxable, and dollar denominated. The index covers the U.S. investment-grade fixed rate bond market, with index components for government and corporate securities, mortgage pass-through securities, and asset-backed securities.
The Standard & Poor’s 500 Index is a capitalization-weighted index of 500 stocks designed to measure performance of the broad domestic economy through changes in the aggregate market value of 500 stocks representing all major industries. It cannot be invested into directly.
The MSCI Emerging Markets Index is a float-adjusted market capitalization index that consists of indices of approximately 800 stocks and is designed to measure equity market performance in 23 emerging economies: Brazil, Chile, China, Colombia, Czech Republic, Egypt, Greece, Hungary, India, Indonesia, Korea, Malaysia, Mexico, , Peru, Philippines, Poland, Qatar, Russia, South Africa, Taiwan, Thailand, Turkey, and the United Arab Emirates.
The MSCI EAFE (Europe, Australasia, Far East) Index is a free float-adjusted market capitalization index of approximately 900 stocks and is designed to measure equity market performance in 21 developed market countries outside of North America.
The S&P 500 Telecom Index is a market cap weighted index comprised of those companies included in the S&P 500 that are classified as member of GICS® telecommunication services sector.
The S&P 500 Energy Index is a market cap weighted index comprised of those companies included in the S&P 500 that are classified as member of GICS® energy sector.
The S&P 500 Growth Index is a market-capitalization-weighted index developed by Standard and Poor’s consisting of those stocks within the S&P 500 Index that exhibit strong growth characteristics. The S&P 500/Citigroup Growth Index is a numerical ranking system based on three growth factors and four value factors to determine the constituents and their weightings.
The S&P 500 Value Index is a market-capitalization-weighted index developed by Standard and Poor’s consisting of those stocks within the S&P 500 Index that exhibit strong value characteristics. The S&P 500/Citigroup Value Index uses a numerical ranking system based on four value factors and three growth factors to determine the constituents and their weightings.
The BofA Merrill Lynch Option-Adjusted Spreads (OASs) are the calculated spreads between a computed OAS index of all bonds in a given rating category and a spot Treasury curve. An OAS index is constructed using each constituent bond’s OAS, weighted by market capitalization. The BofA Merrill Lynch High Yield Master II OAS uses an index of bonds that are below investment grade (those rated BB or below).
Company News
Market Commentary
Retirement Planning
Tax Planning
Cyber Security
Important Disclosures
Leonard Rickey Investment Advisors, PLLC (“LRIA”), is an SEC registered investment adviser located in the State of Washington. Registration does not imply a certain level of skill or training. For information pertaining to the registration status of LRIA, please contact LRIA or refer to the Investment Adviser Public Disclosure website (www.adviserinfo.sec.gov).
This is provided for general information only and contains information that is not suitable for everyone. As such, nothing herein should be construed as the provision of specific investment advice or recommendations for any individual. To determine which investments may be appropriate for you, consult your financial advisor prior to investing. There is no guarantee that the views and opinions expressed herein will come to pass. This newsletter contains information derived from third party sources. Although we believe these third-party sources to be reliable, we make no representations as to the accuracy or completeness of any information prepared by any unaffiliated third party incorporated herein and take no responsibility therefore.
Any projections, forecasts and estimates, including without limitation any statement using “expect” or “believe” or any variation of either term or a similar term, contained here are forward-looking statements and are based upon certain current assumptions, beliefs and expectations that LRIA considers reasonable or that the applicable third parties have identified as such. Forward-looking statements are necessarily speculative in nature, and it can be expected that some or all of the assumptions or beliefs underlying the forward-looking statements will not materialize or will vary significantly from actual results or outcomes. Some important factors that could cause actual results or outcomes to differ materially from those in any forward-looking statements include, among others, changes in interest rates and general economic conditions in the U.S. and globally, changes in the liquidity available in the market, change and volatility in the value of the U.S. dollar, market volatility and distressed credit markets, and other market, financial or legal uncertainties. Consequently, the inclusion of forward-looking statements herein should not be regarded as a representation by LRIA or any other person or entity of the outcomes or results that will be achieved by following any recommendations contained herein. While the forward-looking statements here reflect estimates, expectations and beliefs, they are not guarantees of future performance or outcomes. LRIA has no obligation to update or otherwise revise any forward-looking statements, including any revisions to reflect changes in economic conditions or other circumstances arising after the date hereof or to reflect the occurrence of events (whether anticipated or unanticipated), even if the underlying assumptions do not come to fruition. Opinions expressed herein are subject to change without notice and do not necessarily take into account the particular investment objectives, financial situations, or particular needs of all investors.
For additional information about LRIA, including fees and services, please contact us for our Form ADV disclosure brochure using our contact information herein. Please read the disclosure brochure carefully before you invest or send money.
2026 1st Quarter Investment Commentary