Jan 23, 2017 4th Quarter 2016 Commentary LRIA
| · President-elect Donald Trump’s election win had a big effect on the financial markets
· U.S. stocks hit to new all-time highs while other classes like gold, bonds and non-U.S. stocks suffered after Trump’s win · The trend in U.S. stocks remained positive. Non-U.S. earnings started to pick up and investors expected increased earnings growth in 2017 · Investors sentiment was bullish suggesting that stocks may be more vulnerable to a correction · The current U.S. economic expansion is the fourth longest in our history. The expansion has been one of the slowest on record but there were few signs of imbalances in the economy |
Market Summary
U.S. stocks, as measured by the S&P 500 Index, reached new all-time highs in the 4th quarter. Investors were hopeful that President-elect Donald Trump will implement pro-growth policy changes including lowering taxes, reducing business regulation and increasing government spending. This quarter marked the third quarter in a row that U.S. stocks hit new all-time highs. Non-U.S. stocks have not fared as well recently and underperformed during the quarter. This was the fourth year in a row that U.S. stocks outperformed both Emerging Markets and Developed International stocks. 2016 marked the eighth consecutive year of positive performance on the S&P 500. U.S. stocks have greatly outperformed non-U.S. stocks during this time but we started to see signs of non-U.S. stocks making a comeback.
The yield on the 10-year U.S. Treasury bond went from 1.60 percent at the beginning of the 4th quarter to 2.45 percent by year-end[1]. The increase in yields resulted primarily from increased expectations for rising inflation going forward and the Federal Reserve’s move to hike interest rates in December. The Federal Reserve raised interest rates .25% to .5%. This was only the second time in eight years that the Federal Reserve raised rates. Here is a summary of returns for the major indexes:
| US Large Stocks
(S&P 500 TR) |
US Small Stocks
(Russell 2000 TR) |
International
(MSCI EAFE) |
Emerging Markets
(MSCI EM) |
US Bonds
(Barclays US Agg Bond TR) |
|
| 4th Quarter 2016 | 3.82% | 8.83% |
-.71% |
-4.16% | -2.98% |
| 2016 | 11.96% | 21.31% | 1.0% | 11.19% | 2.65% |
| 3yr annualized* | 8.87% | 6.74% | -1.6% | -2.55% | 3.03% |
| 5yr annualized* | 14.66% | 14.46% | 6.53% | 1.28% | 2.23% |
| 10yr annualized* | 6.95% | 7.07% | .75% | 1.84% |
4.34% |
*Through December 31, 2016. All returns are in U.S. dollars. Source: Morningstar
“The main purpose of the stock market is to make fools out of as many men as possible.” Bernard Baruch
Many men were made fools after Donald Trump’s surprise win and the ensuing stock market rally. Most polls predicted that Trump would lose the election and most predicted that the stock market would tank if he won. Immediately following the U.S. elections, the Dow Jones Industrial Average index set a new record high. Within several weeks of the election, the S&P 500 index, the technology-heavy Nasdaq index, and the small company Russell 2000 index all followed the Dow Jones lead, and achieved new all-time highs. Investors were clearly bullish, as the new narrative suggested Trump’s policies will be good for U.S. stocks. Other asset classes like bonds, gold, non-U.S. currencies and non-U.S. stocks, which had all performed well up to the election, suffered after the election.
Few thought a Trump victory would happen, but it did. Few thought “Brexit” would happen, but it did. And few thought stocks would rally after each of these events, but they did. While we’re certainly happy with the market’s gains, Trump’s election and “Brexit” re-affirmed our belief that predicting stock performance is a fool’s game and that our time is better spent focusing on things we can control.
2016: A Tale of Two Halves
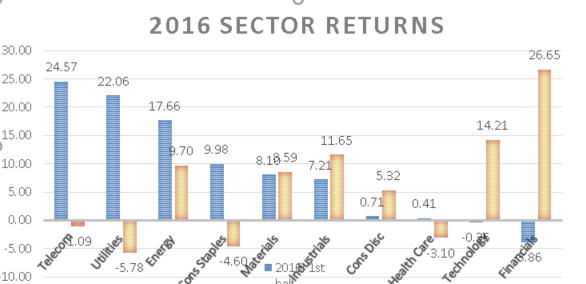
The year started off with one of the worst performances in history. The S&P 500 was down 4.9% in the first four days of trading and by February 11, the S&P 500 was down 10.5%. U.S. stocks quickly recovered to new all-time highs by April as defensive sectors led the way. Sectors such as Utilities, Consumer Staples and Telecommunications performed very well while more cyclical sectors such as Financials, Technology and Consumer Discretionary underperformed. This trend reversed in the second half of the year, particularly after the U.S. election. Financials, Technology & Industrials led the market in the second half. Below is a breakdown of sector returns for the year[2].
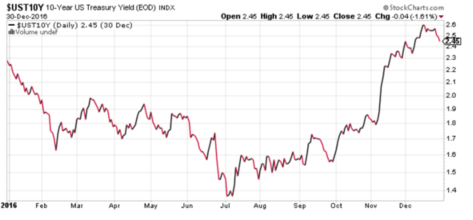
In addition to sectors divergence we saw a large reversal in interest rates beginning in July. Below is a chart of the 10 year US Treasury yield last year[3]. Yields came down to near all-time lows of 1.4% in July and then moved higher to finish the year at 2.45%. Rates are still toward the lower end of their historical range but we could see rates begin to move higher in 2017.
Current Market Trends
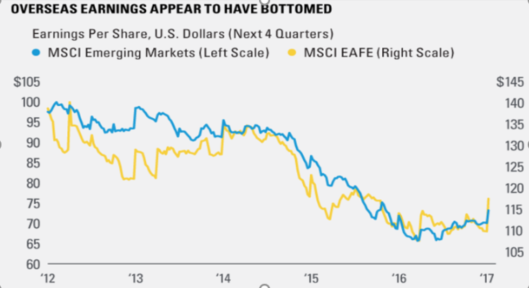
The overall trend in the U.S. stock market finished the quarter in healthy shape. Both U.S. large cap and small cap stocks finished the year near their all-time highs. At one point in December, over 80% of industry groups were in up-trends[4], a sign of healthy breadth in the stock market. The trend in non-U.S. stocks is mixed. Developed International stocks were in a flat trend in 2016 while Emerging Markets stocks were up over 11% last year. Despite a poor fourth quarter performance, the trend in Emerging Market stocks was positive for most of 2016. We saw earnings in non-U.S. stocks increase throughout the year and investor expectations were for earnings to increase more in 2017[5].
Current Market Sentiment
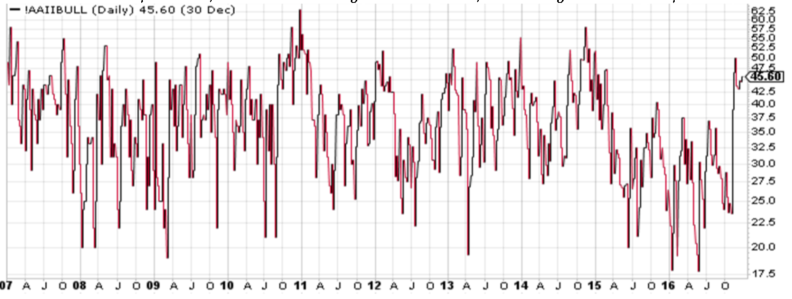
The rally to new highs in U.S. stocks produced a surge in optimism that was evident across multiple sentiment indicators. Sentiment indicators attempt to gauge the current mood of investors. Generally, extremely bullish sentiment is a signal of an overextended stock market that may be more vulnerable to a correction. Just like extremely bullish sentiment may be a signal for a correction, extremely bearish sentiment may be a signal for a market rebound. One prominent indicator is the American Association of Individual Investors poll. It measures the percentage of individual investors who are bullish. It can be a noisy indicator, but the latest reading came in near 45%, near the highs of the last 10 years[6].
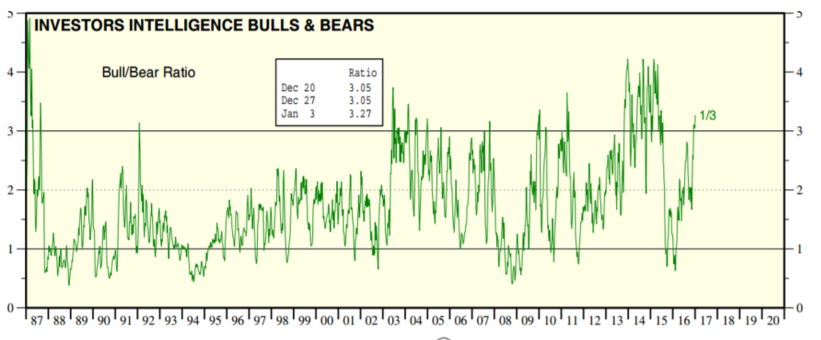
Another sentiment indicator is the Advisors Sentiment report. It surveys the market views of over 100 independent investment newsletters. As of the end of the quarter, there were three time as many bullish advisors as there were bearish advisors. The chart below shows that this near the highs of its history[7].
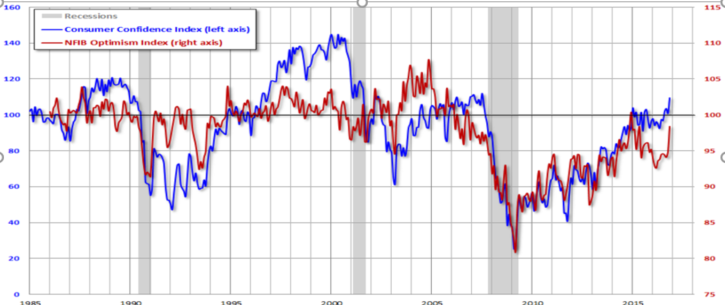
In addition, consumer confidence finished the quarter near recent highs. Consumer confidence polls attempt to measure how consumers feel about the general state of the economy and their personal financial situation. If confidence is high, consumers tend to spend more than if confidence is low. The Conference Board Consumer Confidence Index was at its highest level since 2001 (blue line below) and the NFIB Small Business Economic Trends Index finished 2016 near its highs of the last ten years (red line below)[8].
Economic Update
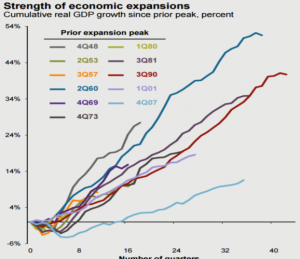
One of the longest (and slowest) expansions in U.S. history continued in 2016. The economic expansion has lasted 90 months, making it the fourth longest since 1900. However, it has also been one of the slowest expansions in U.S. history. The chart below clearly demonstrates the slow recovery of this expansion (light blue line in the current expansion)[9]
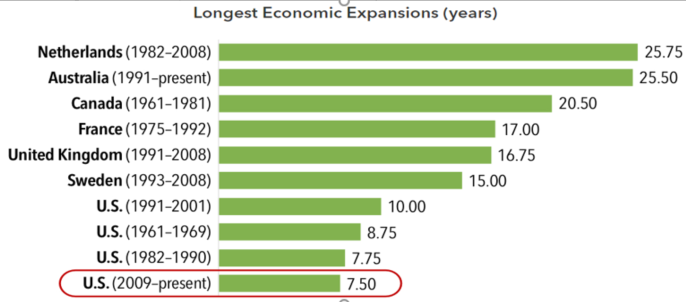
Some worried that the current recovery has lasted too long, and the U.S. was due for a recession. Although we are likely closer to the end of this cycle than the beginning, the current U.S. expansion continued to show that age is nothing but a number. Several countries, including the U.S., have enjoyed significantly longer expansions in the past (See chart below).[10] A few of the positive signs in the economy were a low unemployment rate, low inflation, increased wage growth and increased home prices[11]. Overall, there were few signs of imbalances building in the economy and reason to believe the expansion can continue.
Planning in 2017
With the elections resulting in Republican control of the White House, the Senate and the House, there is a lot of speculation on major tax changes in 2017. We don’t want to speculate at this point and will review any planning opportunities if and when laws change.
Below are a few updated figures for 2017 account contribution limits for pertinent retirement and other savings vehicles.
- IRA/Roth IRA Contribution limits: $5,500 ($1,000 catch-up for 50 & older)
- 401(k) Contribution: $18,000 ($6,000 catch-up for 50 & older)
- HSA Contribution: $6,750 for family health coverage, $3,400 for Individuals ($1,000 catch-up for 55 & older)If you have any questions or would like more information on how this affects your accounts, please contact us.
[1] Yahoo! Finance
[2] Data provided by Morningstar
[3] Stockcharts.com
[4] Willie Delwich, CMT, Baird & Co
[5] LPL Research
[6] StockCharts.com
[7] Yardeni Research
[8] Advisor Perspectives
[9] JPMorgan, Guide to the Markets 1st Quarter 2017
[10] Capital Group
[11] Federal Reserve Economic Data
IMPORTANT DISCLOSURES
Leonard Rickey Investment Advisors, PLLC (“LRIA”), is an SEC registered investment adviser located in the State of Washington. Registration does not imply a certain level of skill or training. For information pertaining to the registration status of LRIA, please contact LRIA or refer to the Investment Adviser Public Disclosure website (www.adviserinfo.sec.gov).
This newsletter is provided for general information only and contains information that is not suitable for everyone. As such, nothing herein should be construed as the provision of specific investment advice or recommendations for any individual. To determine which investments may be appropriate for you, consult your financial advisor prior to investing. All performance referenced is historical and is no guarantee of future results. All indices are unmanaged and cannot be invested into directly. Unmanaged index returns do not reflect fees, expenses, or sales charges. Index performance is not indicative of the performance of any investment.
Past performance is no guarantee of future results. Your experience may vary according to your individual circumstances and there can be no assurance that LRIA will be able to achieve similar results for all clients in comparable situations or that any particular strategy or investment will prove profitable. As investment returns, inflation, taxes and other economic conditions vary, your actual results may vary significantly. There is no guarantee that the views and opinions expressed herein will come to pass. This newsletter contains information derived from third party sources. Although we believe these third party sources to be reliable, we make no representations as to the accuracy or completeness of any information prepared by any unaffiliated third party incorporated herein, and take no responsibility therefore.
Stock investing includes numerous specific risks including the fluctuations of dividend, loss of principal, and potential illiquidity of the investment in a falling market. International and emerging markets investing involves special risks such as currency fluctuation and political instability and may not be suitable for all investors. Small cap stocks may be subject to a higher degree of risk than more established companies’ securities. The illiquidity of the small cap market may adversely affect the value of these investments. Information presented herein is subject to change without notice and should not be considered as a solicitation to buy or sell any security. This newsletter should not be regarded as a complete analysis of the subjects discussed.
Any projections, forecasts and estimates, including without limitation any statement using “expect” or “believe” or any variation of either term or a similar term, contained here are forward-looking statements and are based upon certain current assumptions, beliefs and expectations that LRIA considers reasonable or that the applicable third parties have identified as such. Forward-looking statements are necessarily speculative in nature, and it can be expected that some or all of the assumptions or beliefs underlying the forward-looking statements will not materialize or will vary significantly from actual results or outcomes. Some important factors that could cause actual results or outcomes to differ materially from those in any forward-looking statements include, among others, changes in interest rates and general economic conditions in the U.S. and globally, changes in the liquidity available in the market, change and volatility in the value of the U.S. dollar, market volatility and distressed credit markets, and other market, financial or legal uncertainties. Consequently, the inclusion of forward-looking statements herein should not be regarded as a representation by LRIA or any other person or entity of the outcomes or results that will be achieved by following any recommendations contained herein. While the forward-looking statements here reflect estimates, expectations and beliefs, they are not guarantees of future performance or outcomes. LRIA has no obligation to update or otherwise revise any forward-looking statements, including any revisions to reflect changes in economic conditions or other circumstances arising after the date hereof or to reflect the occurrence of events (whether anticipated or unanticipated), even if the underlying assumptions do not come to fruition. Opinions expressed herein are subject to change without notice and do not necessarily take into account the particular investment objectives, financial situations, or particular needs of all investors.
Bonds are subject to market and interest rate risk if sold prior to maturity. Bond values and yields will decline as interest rates rise and bonds are subject to availability and change in price. The risks associated with investment-grade corporate bonds are considered significantly higher than those associated with first-class government bonds. The difference between rates for first-class government bonds and investment-grade bonds is called investment-grade spread. The range of this spread is an indicator of the market’s belief in the stability of the economy.
The fast price swings in commodities and currencies can result in significant volatility in an investor’s holdings.
There is no assurance that the techniques and strategies discussed are suitable for all investors or will yield positive outcomes. The
Value investments can perform differently from the market as a whole. They can remain undervalued by the market for long periods of time.
The economic forecasts set forth in the presentation may not develop as predicted and there can be no guarantee that strategies promoted will be successful.
For additional information about LRIA, including fees and services, send for our disclosure statement as set forth on Form ADV using our contact information herein. Please read the disclosure statement carefully before you invest or send money.
INDEX DEFINITIONS
The Barclays Aggregate Bond Index represents securities that are SEC-registered, taxable, and dollar denominated. The index covers the U.S. investment-grade fixed rate bond market, with index components for government and corporate securities, mortgage pass-through securities, and asset-backed securities.
The Russell 2000 Index is an unmanaged index generally representative of the 2,000 smallest companies in the Russell Index, which represents approximately 10% of the total market capitalization of the Russell 3000 Index.
The Standard & Poor’s 500 Index is a capitalization-weighted index of 500 stocks designed to measure performance of the broad domestic economy through changes in the aggregate market value of 500 stocks representing all major industries. It cannot be invested into directly.
The MSCI EM Index is a float-adjusted market capitalization index that consists of indices of approximately 800 stocks and is designed to measure equity market performance in 23 emerging economies: Brazil, Chile, China, Colombia, Czech Republic, Egypt, Greece, Hungary, India, Indonesia, Korea, Malaysia, Mexico, Morocco, Peru, Philippines, Poland, Qatar, Russia, South Africa, Taiwan, Thailand, and Turkey.
The MSCI EAFE (Europe, Australasia, Far East) Index is a free float-adjusted market capitalization index of approximately 900 stocks and is designed to measure equity market performance in 21 developed market countries outside of North America.
The Dow Jones Industrial Average (DJIA) is a price-weighted average of 30 significant stocks traded on the New York Stock Exchange (NYSE) and the NASDAQ.
The Nasdaq Composite Index is the market capitalization-weighted index of approximately 3,000 common equities listed on the Nasdaq stock exchange. The types of securities in the index include American depositary receipts, common stocks, real estate investment trusts (REITs) and tracking stocks, as well as limited partnership interests.
The S&P 500 Cons Discretionary Index is a market cap weighted index comprised of those companies included in the S&P 500 that are classified as member of GICS® consumer discretionary sector.
The S&P 500 Cons Staples Index is a market cap weighted index comprised of those companies included in the S&P 500 that are classified as member of GICS® consumer staples sector.
The S&P 500 Energy Index is a market cap weighted index comprised of those companies included in the S&P 500 that are classified as member of GICS® energy sector.
The S&P 500 Financials Index is a market cap weighted index comprised of those companies included in the S&P 500 that are classified as member of GICS® financials sector.
The S&P 500 Health Care Index is a market cap weighted index comprised of those companies included in the S&P 500 that are classified as member of GICS® health care sector.
The S&P 500 Industrials Index is a market cap weighted index comprised of those companies included in the S&P 500 that are classified as member of GICS® industrials sector.
The S&P 500 Materials Index is a market cap weighted index comprised of those companies included in the S&P 500 that are classified as member of GICS® materials sector.
The S&P 500 Telecom Index is a market cap weighted index comprised of those companies included in the S&P 500 that are classified as member of GICS® telecommunication services sector
The S&P 500 Technology Index is a market cap weighted index comprised of those companies included in the S&P 500 that are classified as member of GICS® information technology sector.
The S&P 500 Utilities Index is a market cap weighted index comprised of those companies included in the S&P 500 that are classified as member of GICS® utilities sector.
Company News
Market Commentary
Retirement Planning
Tax Planning
Cyber Security
Important Disclosures
Leonard Rickey Investment Advisors, PLLC (“LRIA”), is an SEC registered investment adviser located in the State of Washington. Registration does not imply a certain level of skill or training. For information pertaining to the registration status of LRIA, please contact LRIA or refer to the Investment Adviser Public Disclosure website (www.adviserinfo.sec.gov).
This is provided for general information only and contains information that is not suitable for everyone. As such, nothing herein should be construed as the provision of specific investment advice or recommendations for any individual. To determine which investments may be appropriate for you, consult your financial advisor prior to investing. There is no guarantee that the views and opinions expressed herein will come to pass. This newsletter contains information derived from third party sources. Although we believe these third-party sources to be reliable, we make no representations as to the accuracy or completeness of any information prepared by any unaffiliated third party incorporated herein and take no responsibility therefore.
Any projections, forecasts and estimates, including without limitation any statement using “expect” or “believe” or any variation of either term or a similar term, contained here are forward-looking statements and are based upon certain current assumptions, beliefs and expectations that LRIA considers reasonable or that the applicable third parties have identified as such. Forward-looking statements are necessarily speculative in nature, and it can be expected that some or all of the assumptions or beliefs underlying the forward-looking statements will not materialize or will vary significantly from actual results or outcomes. Some important factors that could cause actual results or outcomes to differ materially from those in any forward-looking statements include, among others, changes in interest rates and general economic conditions in the U.S. and globally, changes in the liquidity available in the market, change and volatility in the value of the U.S. dollar, market volatility and distressed credit markets, and other market, financial or legal uncertainties. Consequently, the inclusion of forward-looking statements herein should not be regarded as a representation by LRIA or any other person or entity of the outcomes or results that will be achieved by following any recommendations contained herein. While the forward-looking statements here reflect estimates, expectations and beliefs, they are not guarantees of future performance or outcomes. LRIA has no obligation to update or otherwise revise any forward-looking statements, including any revisions to reflect changes in economic conditions or other circumstances arising after the date hereof or to reflect the occurrence of events (whether anticipated or unanticipated), even if the underlying assumptions do not come to fruition. Opinions expressed herein are subject to change without notice and do not necessarily take into account the particular investment objectives, financial situations, or particular needs of all investors.
For additional information about LRIA, including fees and services, please contact us for our Form ADV disclosure brochure using our contact information herein. Please read the disclosure brochure carefully before you invest or send money.
2026 1st Quarter Investment Commentary