Oct 17, 2017 3rd Quarter Commentary
Summary of 3rd quarter 2017 commentary
- U.S. stocks reached new all-time highs for the fifth quarter in a row
- Volatility in the U.S. stock market remained near record lows
- The U.S. bull market is the second longest since World War II and U.S. stock valuations look high
- We are making significant changes in your accounts due to high stock valuations and low bond yields
- We are introducing new asset classes in efforts to potentially reduce risks and seek to diversify your accounts
Market Summary
U.S. stocks, as measured by the S&P 500, continued their uptrend and reached new all-time highs for the fifth quarter in a row. This quarter marked the second longest U.S. bull market since World War II (trailing only the 1990’s bull market)[1]. Similar to the previous two quarters, conditions for stocks were relatively positive as illustrated by low volatility, positive economic growth and strong corporate earnings growth.
This current U.S. economic expansion is the third longest on record since World War II[2]. The expansion has been one of the slowest on record although the growth has been consistently positive. This quarter was no different – economic growth in the U.S. was positive, albeit slow. We saw continued improvement in non-U.S. economic growth and corporate earnings. U.S. inflation numbers were moderate and unemployment was near record lows.
Despite the recent natural disasters in the U.S. and the ongoing tension with North Korea, we’ve seen the third lowest annualized volatility since 1928 so far this year[3]. There is no clear answer as to why the markets were so calm. Several potential catalysts could increase volatility in the coming quarters including the threat of military escalation with North Korea and a political fight over the U.S. budget and debt ceiling negotiations. The wind down of European Central Bank (ECB) asset purchases plus tightening from the U.S. Federal Reserve could mean markets lose a powerful tailwind for economic stimulus and asset price inflation. Finally, high stock valuations, particularly in the U.S., may create a long term drag on future returns.
Below is a summary of returns for the major indexes[4]
| US Large Stocks (S&P 500 TR) | US Small Stocks
(Russell 2000 TR) |
International
(MSCI EAFE) |
Emerging Markets
(MSCI EM) |
US Bonds
(Barclays US Agg Bond TR) |
|
| 3rd Quarter 2017* | 4.48% | 5.67% | 5.4% | 7.89% | .85% |
| 2017 YTD | 14.24% | 10.94% | 19.96% | 27.78% | 3.14% |
| 3yr annualized* | 10.81% | 12.18% | 5.04% | 4.9% | 2.71% |
| 5yr annualized* | 14.22% | 13.79% | 8.38% | 3.99% | 2.06% |
| 10yr annualized* | 7.44% | 7.85% | 1.34% | 1.32% | 4.27% |
Allocation Changes
We are in the process of making significant changes to the allocations in your accounts. The changes will include the introduction of new asset classes. We will review these specific changes with you at your next meeting, but wanted to summarize the changes and the evidence we are considering as we make these changes.
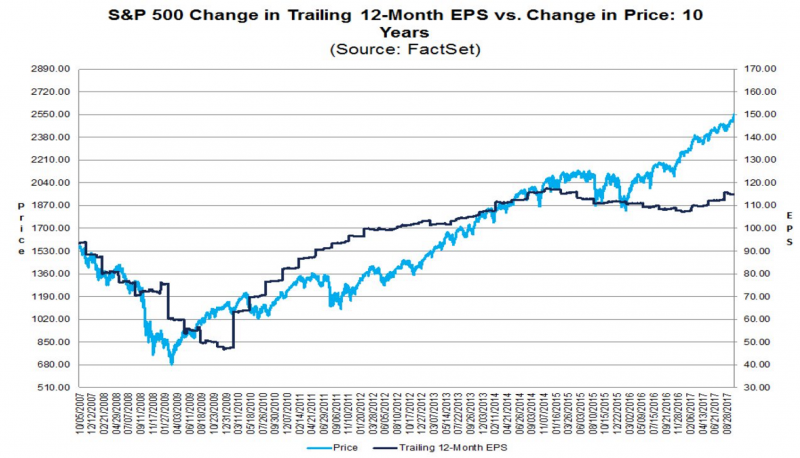
Market prices have been very positive, particularly U.S. stocks. Recent major stock index returns, as evidenced in the previous table, have all been positive[5]. While this is fantastic for portfolio returns, corporate earnings have not kept up. In the United States for example, earnings per share growth has significantly trailed the price of the S&P 500 Index over the last two years (see chart below)[6]
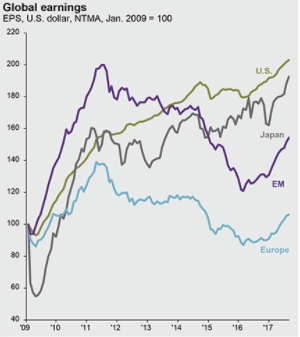
In addition, non-U.S. corporate earnings have lagged U.S. earnings during this cycle but have been rising faster more recently (see chart below)[7].
Compared to non-U.S. stocks, U.S. stocks look overvalued on a variety of metrics. The current price relative to the last ten years’ worth of real earnings (P/E10) is one of the more common valuation metrics. It shows the price an investor is paying for every dollar of earnings. A higher P/E10 means that an investor is paying more for every dollar of earnings. Currently, the P/E10 shows that U.S. stocks are trading at higher valuations than non-U.S. stocks (See table below)[8].
| United States | Developed Europe |
Emerging EmergingMarkets
|
|
| Current P/E10 ratio | 28 | 17.8 | 15.6 |
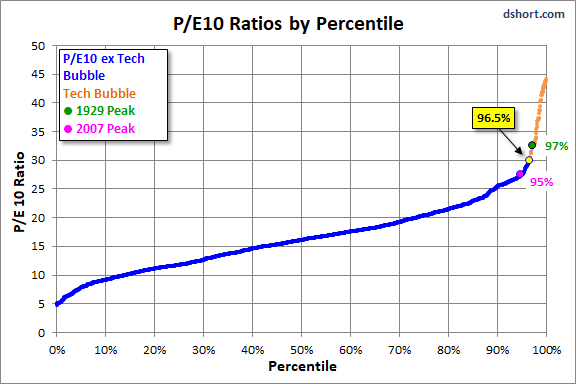
The current U.S. P/E10 ratio is one of the highest on record, putting it in the 96th percentile of highest valuations[9]. Only the Tech Bubble of the late 1990’s and the 1929 peak had higher valuations (See chart below)[10].
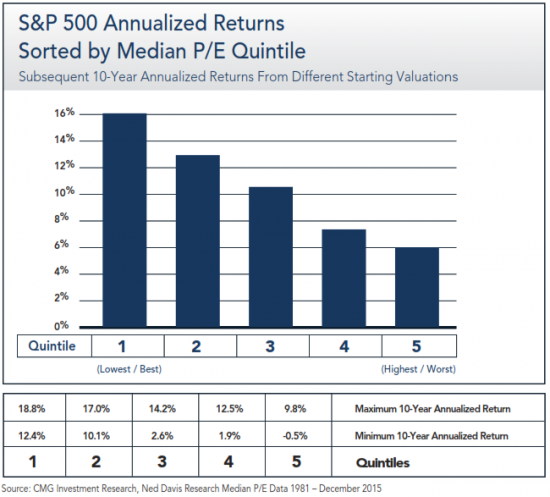
High valuations are significant because there has been research showing that higher starting valuations lead to lower future long-term returns. If earnings slow, we not only change the price based on the current situation, but the growth we were counting on needs to be entirely and quickly accounted for. In the chart below, the current P/E is in the 5th and highest quintile. When this has occurred, not only is the average return in quintile 5 lower but both the maximum and minimum returns are lower as well (see chart at below)[11].
Generally, the first place we would turn to reduce risk in accounts would be the bond market. Due to low current yields, we are expecting positive, but muted returns in the bond market. In addition, the effect of rising rates on bond returns could largely offset the increased yield. This has us looking at other investment opportunities.
We start by looking within our existing asset classes for lower relative valuations. As previously noted, lower valuations can be found in international stocks (both developed and emerging markets). As a result we are planning on shifting a percentage of U.S. stocks to Non-U.S stocks. We have already completed many of these changes.
Then we look for opportunities outside of the traditional stock and bond markets. This includes investments in Managed Futures, Options, Commodities, Real Estate and Reinsurance. A major benefit to these non-traditional or alternative asset classes is that they have historically been uncorrelated to both stocks and bonds. This adds another layer of diversification to your portfolio.
Some of these asset classes may have limited liquidity. This means that it may be harder to get a price on these investments as quickly as the stock or bond market. In addition, many of these investments only allow purchases or sales on a monthly or quarterly basis. They also exhibit poor tax efficiency, so we will mainly be adding these in retirement accounts. Starting in late 2017 and into early 2018 will be increasing exposure to these types of investments.
We look forward to discussing these changes and their effect on your accounts in our next meeting, but wanted to make sure to keep our logic as transparent as possible. It is impossible to know the direction that the market is going. We continue to use all of our tools and combined research to make the best risk adjusted decisions we possibly can based on your investment objective.
As always, please call if you have any questions or would like to discuss in more detail.
IMPORTANT DISCLOSURES
Leonard Rickey Investment Advisors, PLLC (“LRIA”), is an SEC registered investment adviser located in the State of Washington. Registration does not imply a certain level of skill or training. For information pertaining to the registration status of LRIA, please contact LRIA or refer to the Investment Adviser Public Disclosure website (www.adviserinfo.sec.gov).
This newsletter is provided for general information only and contains information that is not suitable for everyone. As such, nothing herein should be construed as the provision of specific investment advice or recommendations for any individual. To determine which investments may be appropriate for you, consult your financial advisor prior to investing. All performance referenced herein is historical in nature and is not an indication of or a guarantee of future results. All indices are unmanaged and cannot be invested into directly. Unmanaged index returns do not reflect fees, expenses, or sales charges. Index performance is not indicative of the performance of any investment.
Your experience may vary according to your individual circumstances and there can be no assurance that LRIA will be able to achieve similar results for all clients in comparable situations or that any particular strategy or investment will prove profitable. As investment returns, inflation, taxes and other economic conditions vary, your actual results may vary significantly. There is no guarantee that the views and opinions expressed herein will come to pass. This newsletter contains information derived from third party sources. Although we believe these third party sources to be reliable, we make no representations as to the accuracy or completeness of any information prepared by any unaffiliated third party incorporated herein, and take no responsibility therefore.
Stock investing includes numerous specific risks including the fluctuations of dividend, loss of principal, and potential illiquidity of the investment in a falling market. International and emerging markets investing involves special risks such as currency fluctuation and political instability and may not be suitable for all investors. Small cap stocks may be subject to a higher degree of risk than more established companies’ securities. The illiquidity of the small cap market may adversely affect the value of these investments. Information presented herein is subject to change without notice and should not be considered as a solicitation to buy or sell any security. This newsletter should not be regarded as a complete analysis of the subjects discussed.
Any projections, forecasts and estimates, including without limitation any statement using “expect” or “believe” or any variation of either term or a similar term, contained here are forward-looking statements and are based upon certain current assumptions, beliefs and expectations that LRIA considers reasonable or that the applicable third parties have identified as such. Forward-looking statements are necessarily speculative in nature, and it can be expected that some or all of the assumptions or beliefs underlying the forward-looking statements will not materialize or will vary significantly from actual results or outcomes. Some important factors that could cause actual results or outcomes to differ materially from those in any forward-looking statements include, among others, changes in interest rates and general economic conditions in the U.S. and globally, changes in the liquidity available in the market, change and volatility in the value of the U.S. dollar, market volatility and distressed credit markets, and other market, financial or legal uncertainties. Consequently, the inclusion of forward-looking statements herein should not be regarded as a representation by LRIA or any other person or entity of the outcomes or results that will be achieved by following any recommendations contained herein. While the forward-looking statements here reflect estimates, expectations and beliefs, they are not guarantees of future performance or outcomes. LRIA has no obligation to update or otherwise revise any forward-looking statements, including any revisions to reflect changes in economic conditions or other circumstances arising after the date hereof or to reflect the occurrence of events (whether anticipated or unanticipated), even if the underlying assumptions do not come to fruition. Opinions expressed herein are subject to change without notice and do not necessarily take into account the particular investment objectives, financial situations, or particular needs of all investors.
Bonds are subject to market and interest rate risk if sold prior to maturity. Bond values and yields will decline as interest rates rise and bonds are subject to availability and change in price. The risks associated with investment-grade corporate bonds are considered significantly higher than those associated with first-class government bonds. The difference between rates for first-class government bonds and investment-grade bonds is called investment-grade spread. The range of this spread is an indicator of the market’s belief in the stability of the economy.
The fast price swings in commodities and currencies can result in significant volatility in an investor’s holdings.
There is no assurance that the techniques and strategies discussed are suitable for all investors or will yield positive outcomes. The
Value investments can perform differently from the market as a whole. They can remain undervalued by the market for long periods of time.
The economic forecasts set forth in the presentation may not develop as predicted and there can be no guarantee that strategies promoted will be successful.
For additional information about LRIA, including fees and services, please contact us for our Form ADV disclosure brochure using our contact information herein. Please read the disclosure brochure carefully before you invest or send money.
INDEX DEFINITIONS
The Barclays Aggregate Bond Index represents securities that are SEC-registered, taxable, and dollar denominated. The index covers the U.S. investment-grade fixed rate bond market, with index components for government and corporate securities, mortgage pass-through securities, and asset-backed securities.
The Standard & Poor’s 500 Index is a capitalization-weighted index of 500 stocks designed to measure performance of the broad domestic economy through changes in the aggregate market value of 500 stocks representing all major industries. It cannot be invested into directly.
The MSCI Emerging Markets Index is a float-adjusted market capitalization index that consists of indices of approximately 800 stocks and is designed to measure equity market performance in 23 emerging economies: Brazil, Chile, China, Colombia, Czech Republic, Egypt, Greece, Hungary, India, Indonesia, Korea, Malaysia, Mexico, , Peru, Philippines, Poland, Qatar, Russia, South Africa, Taiwan, Thailand, Turkey, and the United Arab Emirates.
The MSCI EAFE (Europe, Australasia, Far East) Index is a free float-adjusted market capitalization index of approximately 900 stocks and is designed to measure equity market performance in 21 developed market countries outside of North America.
[1] LPL Financial. Bull market from March 2009 through today.
[2] LPL Financial. Economic expansion from June 2009 through today.
[3] Pension Partners. S&P 500 Index, year to date through 9/26/2017
[4] Morningstar Direct. As of 10/2/2017
[5] Morningstar Direct. As of 10/2/2017
[6] FactSet Data. As of 8/28/2017
[7] JP Morgan, Guide to the Markets. Dated from January 2009 through June 2017
[8] StarCapital, As of 6/30/2017
[9] Advisor Perspectives. As of 9/5/17
[10] Advisor Perspectives. As of 9/5/17
[11] CMG Investment Research, Ned Davis Research Median P/E Data 1981-December 2015
Company News
Market Commentary
Retirement Planning
Tax Planning
Cyber Security
Important Disclosures
Leonard Rickey Investment Advisors, PLLC (“LRIA”), is an SEC registered investment adviser located in the State of Washington. Registration does not imply a certain level of skill or training. For information pertaining to the registration status of LRIA, please contact LRIA or refer to the Investment Adviser Public Disclosure website (www.adviserinfo.sec.gov).
This is provided for general information only and contains information that is not suitable for everyone. As such, nothing herein should be construed as the provision of specific investment advice or recommendations for any individual. To determine which investments may be appropriate for you, consult your financial advisor prior to investing. There is no guarantee that the views and opinions expressed herein will come to pass. This newsletter contains information derived from third party sources. Although we believe these third-party sources to be reliable, we make no representations as to the accuracy or completeness of any information prepared by any unaffiliated third party incorporated herein and take no responsibility therefore.
Any projections, forecasts and estimates, including without limitation any statement using “expect” or “believe” or any variation of either term or a similar term, contained here are forward-looking statements and are based upon certain current assumptions, beliefs and expectations that LRIA considers reasonable or that the applicable third parties have identified as such. Forward-looking statements are necessarily speculative in nature, and it can be expected that some or all of the assumptions or beliefs underlying the forward-looking statements will not materialize or will vary significantly from actual results or outcomes. Some important factors that could cause actual results or outcomes to differ materially from those in any forward-looking statements include, among others, changes in interest rates and general economic conditions in the U.S. and globally, changes in the liquidity available in the market, change and volatility in the value of the U.S. dollar, market volatility and distressed credit markets, and other market, financial or legal uncertainties. Consequently, the inclusion of forward-looking statements herein should not be regarded as a representation by LRIA or any other person or entity of the outcomes or results that will be achieved by following any recommendations contained herein. While the forward-looking statements here reflect estimates, expectations and beliefs, they are not guarantees of future performance or outcomes. LRIA has no obligation to update or otherwise revise any forward-looking statements, including any revisions to reflect changes in economic conditions or other circumstances arising after the date hereof or to reflect the occurrence of events (whether anticipated or unanticipated), even if the underlying assumptions do not come to fruition. Opinions expressed herein are subject to change without notice and do not necessarily take into account the particular investment objectives, financial situations, or particular needs of all investors.
For additional information about LRIA, including fees and services, please contact us for our Form ADV disclosure brochure using our contact information herein. Please read the disclosure brochure carefully before you invest or send money.
2026 1st Quarter Investment Commentary