Oct 30, 2025 2025 3rd Quarter Investment Commentary
- Global equities surged to record highs as the Fed’s rate cut, strong earnings, and large-scale spending in AI-related spending fueled the rally. The S&P 500 gained over 8% in Q3, with leadership concentrated in growth stocks, leaving valuations historically high and breadth narrow.
- Economic growth stayed resilient, with solid consumption and wage growth despite labor market softening and tariff pressures. Policy support from rate cuts and fiscal stimulus, along with ongoing AI capex, underpinned growth.
- Liquidity and AI-driven investment keep risk assets strong, but high valuations and policy uncertainty argue for a balanced, risk-aware stance. Given the inflation and deficit backdrop, entering into Q4, we have a neutral-to-positive equity stance, balanced with shorter-duration fixed income.
- This is for general information and education and should not be construed as advice. Please review with your advisor before making any changes.
Market and Economic Summary
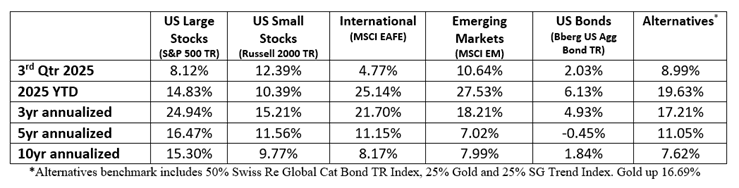
Asset prices surged during Q3, with the broad-based rally resulting in new all-time highs for several categories, including gold, US small- and large-cap stocks, and non-US stocks. Resilient economic data, strong corporate earnings, the removal of some trade-related overhangs, and the Federal Reserve’s .25% interest rate cut in September helped propel returns.
AI remained the dominant force across capital markets and the general economy. Tech companies are engaging in large-scale investments in AI infrastructure, benefiting many AI-related companies and contributing meaningfully to GDP growth. The consensus was that AI is a transformative technology with long-term benefits that justify the high costs. As a result, many companies continued to spend, and investors continued to push AI-related stocks to extremely high valuations.
At the same time, expectations of lower interest rates and easier financial conditions helped small-cap stocks hit new all-time highs for the first time since 2021 – a total of 966 days, the second-longest streak ever. Growth leadership that began after the mid-year market lows extended through the quarter, while more defensive areas of the market lagged. Robust ETF inflows, near-record corporate buybacks, and limited selling pressure supported the market’s resilience. Outside of the U.S, international equities advanced with broad-based gains across both developed and emerging markets (See Table below).
Against this backdrop, the U.S. economy remained resilient—with strong GDP growth and still elevated inflation—even as labor market indicators deteriorated and uncertainty around tariffs and fiscal policy persisted. Signs of a weakening labor market helped spur the Federal Reserve to cut rates in September for the first time this year.
Fixed income posted modest gains this quarter, with the Bloomberg Aggregate up 2%. The U.S. dollar stabilized during the quarter, and gold2 surged over 16% during the quarter and over 47% year-to-date, its best run since 1979. Below is a summary of benchmark returns (1).
Markets
U.S. equities advanced strongly in the third quarter despite several potentially negative factors, including Tariffs, profit margins, valuations, labor market trends, and questions about Federal Reserve policy independence, all of which contributed to a wall of worry. These risks did not materialize, and stocks rallied as confidence returned.
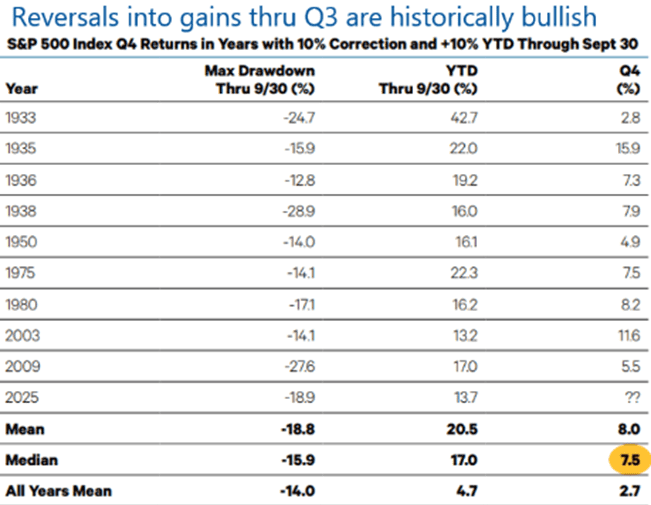
Since 1942, 20% drawdowns have occurred about every five and a half years. This decade has already seen three. Right tails arise just as often, and compounding depends on capturing them. The S&P 500 was up more than 30% from April lows, marking one of the best five-month runs in history. Forward returns after such surges have historically been positive across 6– 12-month horizons. Further, when the S&P 500 index has rebounded from a 10% correction to gain at least 10% through Q3, it has often carried that momentum through year-end (2).
Underlying fundamentals across corporate sectors remained sound, supported by resilient consumer balance sheets, healthy corporate earnings, and a still-accommodative policy backdrop. Earnings growth remained positive across regions in Q3, although upward momentum slowed from previous months. Emerging markets and the U.S. achieved double-digit year-over-year earnings growth, while non-U.S. developed markets experienced slower but positive profit growth results. Investors continued to anticipate positive earnings growth over the next 12 months across all regions.
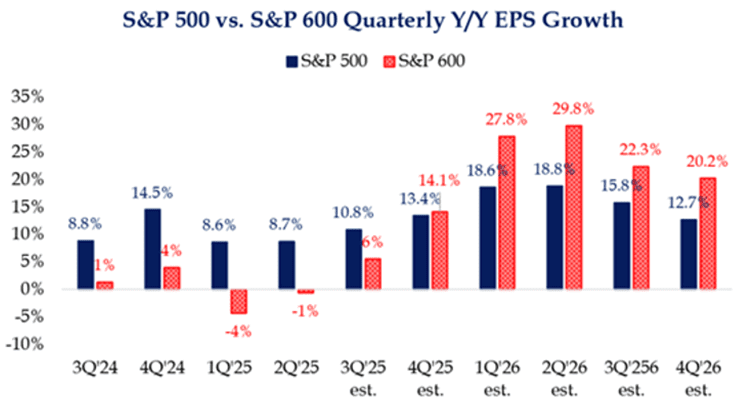
Within small caps, investors have been focused on elevated interest expense and persistent profitability challenges. However, with interest rates coming down and expected to fall further in 2026, it was notable that the earnings outlook for small caps in 2026 shifted meaningfully. The Fed’s Summary of Economic Projections anticipates two future drops as of the September meeting. Part of this improvement could be attributed to easier year-over-year comparisons; it’s also the first time in years that we have seen a sustained and meaningful earnings growth outlook for small caps (see chart (3)).
The S&P 500 is selling at about 24 times expected earnings compared to its historical average of about 17 times. That makes it easy to conclude the market is overvalued. However, the anticipated growth in S&P 500 earnings has also risen. A decade ago, expectations were that its earnings would grow about 7% yearly. Today, that number is double digits due to mega-cap tech companies.
Never have we seen such large companies accelerate their growth as they get larger, which has produced strong earnings and stock prices. It has also led to the S&P 500 becoming highly concentrated. The ten-largest stocks represent nearly 40% of the index, and just two sectors (Technology and Communication) make up 45% of the index.
The S&P 500 has effectively become a highly concentrated, technology growth fund that should sell at higher valuations. The increased concentration, coupled with valuations near historically high levels and capital expenditures accounting for a disproportionate amount of overall growth, led some investors to say we are in a bubble. A significant contrast from the 1990s tech bubble is that the 90’s expansion was fueled by debt, while earnings and free cash flow fund much of today’s expansion. We do recognize, however, that high valuations offer less margin of safety for any downside risks.
The valuation spread between U.S. value and growth stocks remained relatively wide. The Russell 1000 Value traded at 18.2 times forward earnings versus 31.1 times for the Russell 1000 Growth Index. The differential has rarely been this large during the last 20 years.
Economy
The U.S. economy remained remarkably resilient. Consumers continued to spend, and growth broadly held up better than many expected. Wage growth remained above inflation (4), which flowed through to consumer spending. The combination of strong wage growth and strong consumption helped produce a substantial tailwind for the economy and continued to translate into higher GDP and corporate profits.
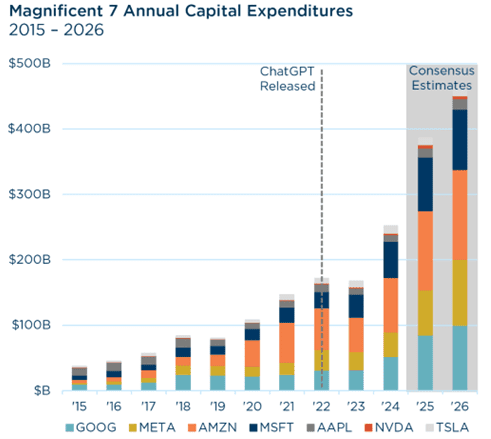
In addition, tech-related spending on the AI buildout continued to meaningfully lift GDP growth. Tech companies’ capital expenditures (including information processing equipment investment, software, power facility construction, manufacturing structures, and data center construction) have proliferated since the launch of ChatGPT in 2022, and estimates predict continued growth next year (5). Capex trends in other industries and smaller businesses remained muted, with business-friendly tax cuts and deregulatory policies confronting headwinds from tariffs and policy uncertainty.
Fiscal and monetary support could also help the economy in the coming quarters. The Fed not only cut rates but signaled additional cuts were likely. In addition, fiscal stimulus occurred via the passage of One Big Beautiful Bill (OBBBA), which solidified and boosted tax cuts, likely providing a modest cyclical lift to the economy and a pronounced boost to business cash flows and profits over the next year.
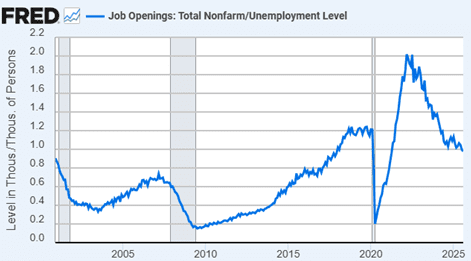
However, some signs of economic stress were seen in weak housing data and slowing labor markets. Higher rates continued to freeze existing homeowners in place, and renovation activity slowed. Multiple indicators pointed to a weaker labor market. For example, for the first time since 2021, the number of unemployed workers exceeded the number of job openings (see chart (6)). Overall, the unemployment rate rose to 4.3% in August, a 4-year high.
A widening unemployment rate typically signals slower growth, weaker demand, and cooling wage pressures. However, changing immigration policy could lead to weaker labor force growth, which could limit any meaningful unemployment rate rise or wage growth slowdown. If labor markets hold together, we would expect household balance sheets to remain healthy, and consumption to maintain momentum.
Trade policy continued to be a source of uncertainty during the quarter. Increased tariff rates were still in the early stages of spreading through the economy, so their full effects were still likely to be felt. We know that the average U.S. tariff rate remained at 90-year highs, a steep rise from less than 3% at the beginning of the year. While precise analysis is impossible, a reasonable estimate is that the actual tariff rate (derived by dividing tariff revenue by US imports of goods) was around 13% in the third quarter, close to where most economists expected at the beginning of the year. Policy remains highly uncertain, but tariff news will likely continue to weigh on growth and boost inflation in the short term.
Please reach out to your advisor with any questions.
Footnotes:
- Morningstar Direct, Factset. As of 9/30/2025
- Ned Davis Research, as of 9/30/2025
- Strategas, as of 9/30/2025
- U.S. BLS, JPMorgan Guide to the Markets. Wage growth of 3.9% vs Core CPI of 3.1%, as of August 2025.
- Strategas, Goldman Sachs. Data as of 8/22/2025
- U.S. BLS via Federal Reserve Economic Database
INDEX DEFINITIONS
The Barclays Aggregate Bond Index represents securities that are SEC-registered, taxable, and dollar denominated. The index covers the US investment-grade fixed rate bond market, with index components for government and corporate securities, mortgage pass-through securities, and asset-backed securities.
The Standard & Poor’s 500 Index is a capitalization-weighted index of 500 stocks designed to measure performance of the broad domestic economy through changes in the aggregate market value of 500 stocks representing all major industries. It cannot be invested into directly.
The Russell 2000 Index is an unmanaged index generally representative of the 2,000 smallest companies in the Russell Index, which represents approximately 10% of the total market capitalization of the Russell 3000 Index.
The MSCI Emerging Markets Index is a float-adjusted market capitalization index that consists of indices of approximately 800 stocks and is designed to measure equity market performance in 23 emerging economies: Brazil, Chile, China, Colombia, Czech Republic, Egypt, Greece, Hungary, India, Indonesia, Korea, Malaysia, Mexico, , Peru, Philippines, Poland, Qatar, Russia, South Africa, Taiwan, Thailand, Turkey, and the United Arab Emirates.
The MSCI EAFE (Europe, Australasia, Far East) Index is a free float-adjusted market capitalization index of approximately 900 stocks and is designed to measure equity market performance in 21 developed market countries outside of North America.
The SG Trend Index is a subset of the SG CTA Index and follows traders of trend following methodologies. The SG CTA Index is equal weighted, calculates the daily rate of return for a pool of CTAs selected from the larger managers that are open to new investment.
Swiss Re Global Cat Bond Index tracks the aggregate performance of all catastrophe bonds issued offered under Rule 144A. The index captures bonds denominated in any currency, all rated and unrated cat bonds, outstanding perils, and triggers. The index is not exposed to currency risk from non-USD denominated cat bonds.
The Nasdaq Composite Index is a market capitalization-weighted index of more than 3,000 stocks listed on the Nasdaq stock exchange.
Gold is the spot price at which gold is traded on the New York Mercantil Exchange’s Commodities Exchange
Company News
Market Commentary
Retirement Planning
Tax Planning
Cyber Security
Important Disclosures
Leonard Rickey Investment Advisors, PLLC (“LRIA”), is an SEC registered investment adviser located in the State of Washington. Registration does not imply a certain level of skill or training. For information pertaining to the registration status of LRIA, please contact LRIA or refer to the Investment Adviser Public Disclosure website (www.adviserinfo.sec.gov).
This is provided for general information only and contains information that is not suitable for everyone. As such, nothing herein should be construed as the provision of specific investment advice or recommendations for any individual. To determine which investments may be appropriate for you, consult your financial advisor prior to investing. There is no guarantee that the views and opinions expressed herein will come to pass. This newsletter contains information derived from third party sources. Although we believe these third-party sources to be reliable, we make no representations as to the accuracy or completeness of any information prepared by any unaffiliated third party incorporated herein and take no responsibility therefore.
Any projections, forecasts and estimates, including without limitation any statement using “expect” or “believe” or any variation of either term or a similar term, contained here are forward-looking statements and are based upon certain current assumptions, beliefs and expectations that LRIA considers reasonable or that the applicable third parties have identified as such. Forward-looking statements are necessarily speculative in nature, and it can be expected that some or all of the assumptions or beliefs underlying the forward-looking statements will not materialize or will vary significantly from actual results or outcomes. Some important factors that could cause actual results or outcomes to differ materially from those in any forward-looking statements include, among others, changes in interest rates and general economic conditions in the U.S. and globally, changes in the liquidity available in the market, change and volatility in the value of the U.S. dollar, market volatility and distressed credit markets, and other market, financial or legal uncertainties. Consequently, the inclusion of forward-looking statements herein should not be regarded as a representation by LRIA or any other person or entity of the outcomes or results that will be achieved by following any recommendations contained herein. While the forward-looking statements here reflect estimates, expectations and beliefs, they are not guarantees of future performance or outcomes. LRIA has no obligation to update or otherwise revise any forward-looking statements, including any revisions to reflect changes in economic conditions or other circumstances arising after the date hereof or to reflect the occurrence of events (whether anticipated or unanticipated), even if the underlying assumptions do not come to fruition. Opinions expressed herein are subject to change without notice and do not necessarily take into account the particular investment objectives, financial situations, or particular needs of all investors.
For additional information about LRIA, including fees and services, please contact us for our Form ADV disclosure brochure using our contact information herein. Please read the disclosure brochure carefully before you invest or send money.
2025 4th Quarter Investment Commentary