Apr 14, 2023 2023 1st Quarter Investment Commentary
- Stocks, as measured by the S&P 500, rose for the second quarter in a row but remain in a year-long trading range.
- The second largest bank failure in U.S. history quickly changed bond yields. Markets were priced for interest rate cuts by the end of 2023. The dramatic change in interest rate expectations caused a reversal in last year’s performance trends.
- Many important technical indicators showed positive signs of a continued uptrend for stocks while economic indicators pointed toward increased risks of recession. The uncertain environment leads us to be neutral on equities and positioned for many possible outcomes.
Market Summary
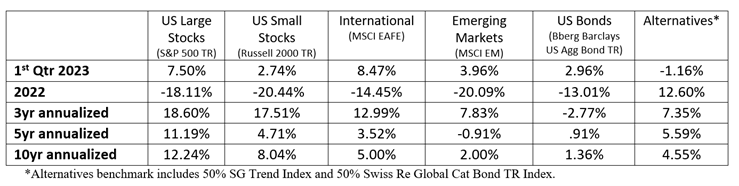
Global stocks rose for the second quarter in a row as investors welcomed signs from central banks that interest rates may not rise as much as expected. The S&P 500 Index rose more than 7%; the tech-heavy Nasdaq went up 17%, and non-U.S. developed stocks were up over 8% (1). Investor expectations around inflation and interest rates changed dramatically during the quarter. At the beginning of the quarter, investors were most concerned with higher inflation, but that quickly changed to concerns of a liquidity crisis stemming from bank failures. While the Fed raised rates in March, they made significant adjustments to the language and tone. As a result, market expectations quickly changed from pricing in additional interest rate hikes to rate cuts by the end of this year.
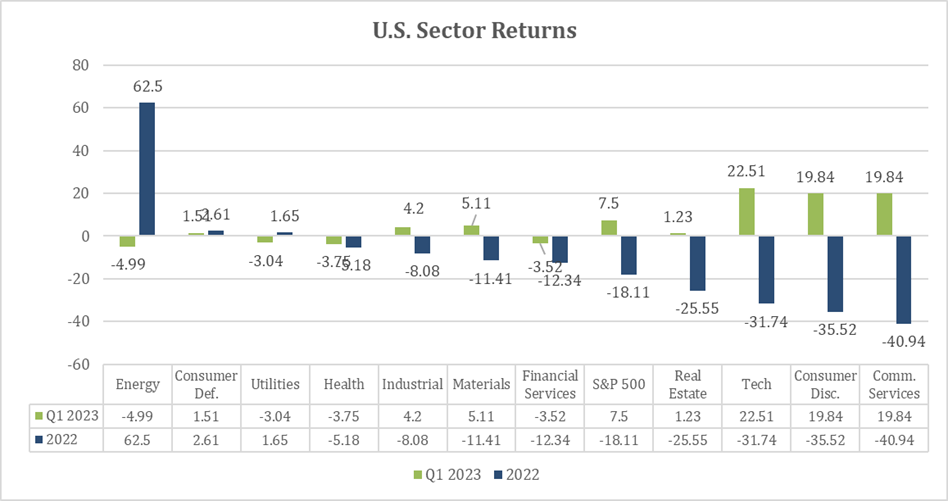
The change in interest rate expectations caused many of 2022’s trends to reverse. Investors rotated back into beaten-up technology stocks and away from energy-related stocks that did so well in 2022. Growth stocks outperformed value stocks, large cap stocks outperformed small cap stocks and cyclical stocks outperformed defensive stocks. One of the few trends that didn’t reverse was the continued outperformance of non-U.S. developed market stocks versus US stocks.
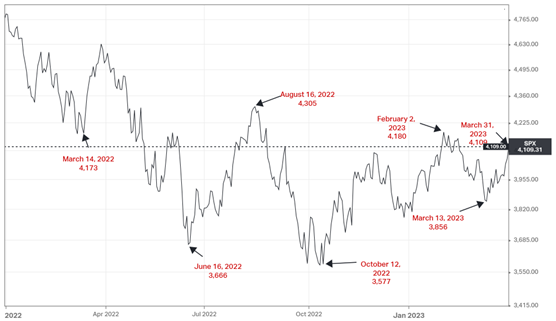
US stocks have been stuck in a 12% trading range for over a year. The S&P 500 ended the quarter around the same level it was six weeks ago, four months ago, seven months ago, and eleven months ago. With all the volatility and dire headlines over the last year, the S&P 500 has traded in a sideways range between 3700 and 4200.
After one of the worst years in history for bonds in 2022, the bond market finished the first quarter in positive territory. Moreover, while bonds saw elevated volatility in the quarter, all major market segments had positive returns. Notably, corporate bonds did not show signs of systematic issues related to risks in the banking sector. Below is a summary of the major benchmark returns. (2)
Market Analysis
There was plenty of bad news to worry markets during the quarter, including forecasts of imminent recession, sticky inflation, and the second-largest bank failures in US history. This backdrop created a lot of volatility, but through it all stocks showed remarkable resilience and posted gains for the second quarter in a row.
It appeared that the quick response from regulators was enough to alleviate the systematic risks from the banking system. Concern that tighter lending standards from banks would pull forward recession risks weighed on the most economically sensitive sectors, including value and small-cap stocks. At the same time, investors bid up higher-valued growth stocks based on an outlook of lower interest rates. Sector leadership during the quarter was nearly the inverse of what we saw in 2022 (3).
US stocks remained in a trading range from spring of last year. The below graph shows the S&P 500 Index from January 2022 through the quarter end (4). The horizontal line depicts where the index finished this quarter – near a level we have traded at many times over the last year. On one hand, the S&P 500 was well off its October lows, and the rally has lasted longer and risen further than what is typically seen during bear market rallies. On the other hand, it remained stuck below key overhead resistance.
Despite two straight quarters of stock market gains, market sentiment remained negative. According to a recent Bank of America survey of fund managers, cash remained the most favored asset, while US stocks remained the most out-of-favor. Other sentiment indicators showed an extreme level of pessimism – a condition that has been in place for over a year. Stocks remained unloved and continued to be a contrarian investment.
Stocks have historically done well when pessimism is high and poorly when pessimism is low. At some point, the bad news gets priced in, setting the stage for potential positive surprises and stock prices. Changes in the market environment are seldom clear-cut and easy to recognize, but some technical indicators signalled we might have reached that point.
Several constructive technical signs appeared during the quarter, which set up a background for the possible start of a new uptrend in stocks. Indicators showed several rare signals that have historically been favorable for stocks over the next year. Also, seasonality was favorable, and sentiment was negative, giving weight to the potential of continued gains.
The highly uncertain economic environment makes it challenging to commit that a new uptrend in stocks will persist. Still, it’s important to recognize that stock prices may indicate recession fears are over-blown or already priced in. After all, stocks historically rally well before any economic uncertainties subside. Said another way: the price tends to improve before the economy.
Economic Analysis
For the past year, the economic environment could be characterized by one main driver – the Fed’s campaign to raise interest rates to combat high inflation. Economic data showed the economy performing surprisingly well and inflation remained surprisingly high. However, expectations for the economy and Fed policy were quickly recalibrated following the bank failures this quarter.
Although economic data remained resilient so far, the bank instability increased the risk of a recession. In response, the Fed signaled it was more willing to pause rate hikes to monitor the economy for potential ripple effects. So far, shocks in the banking sector did not appear to be systemic but did seem likely to impact economic growth negatively as banks tighten lending standards.
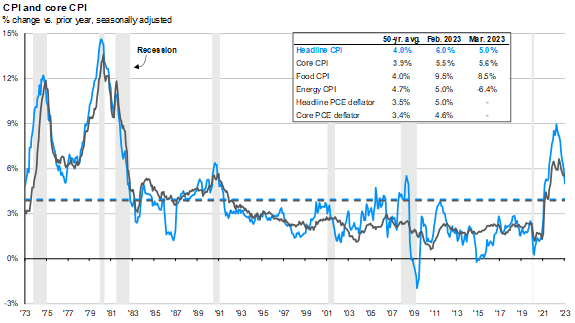
As the headlines turned toward the banking sector, inflation remained well above the Fed’s target of 2% (see graph) (5). Inflation for goods had come down, but inflation was proving more challenging to defeat in the service sector. Specifically, wage inflation remained high. Inflation seems likely to continue to moderate, but the problem is that markets have embedded it into prices. By pricing assets in a way that assumes that inflation will come down rapidly and in a straight line, investors have put themselves in the position of relying on inflation to come down rapidly and in a straight line. It isn’t impossible, but the historical record suggests that inflation shocks tend to persist for years rather than quarters.
Ultimately, the economic landscape presented a contrasting picture to market indicators. While many market indicators suggested a new uptrend in stocks may be underway, many leading economic indicators pointed toward a recession and potentially sticky inflation. So far, the widely anticipated recession has not materialized as consumer spending and employment were holding up. The data gives hope for a “soft landing” scenario where economic growth stays positive and inflation moderates. While possible, our base case continues to be that a recession will be difficult to avoid, but it may take longer than initially expected to materialize.
Portfolio Positioning
We reduced equity positions during the quarter to a neutral stance. Technical indicators suggest stocks could see further gains, while economic signals point toward lower growth. Cash and bonds yield over 4%, so we can get a return while we wait for an environment that gives us a better opportunity. Given the uncertain landscape, we aren’t positioning portfolios for any specific outcome but believe staying diversified to several potential scenarios is essential. Given their low valuations and relative strength, we continue to favor value stocks over growth stocks and see potential to add to our non-U.S. positions.
We are overweight short-term bonds on the fixed-income side because we believe markets are currently pricing in significant rate cuts. We are not convinced that the Fed will cut rates given how resilient the labor market is and that inflation hasn’t been tamed yet. In our minds, there is a significant risk of a scenario where inflation is stickier and economic growth is too strong to let the Fed take a breather.
Please reach out to your advisor if you have any questions or concerns.
[1] Morningstar Direct, as of 3/31/2023
[2] Morningstar Direct, as of 3/31/2023
[3] Morningstar Direct, as of 3/31/2023 using Morningstar sector indexes
[4] Koyfin, S&P 500 Index from 1/1/22-3/31/23
[5] JPMorgan, Guide to the Markets
INDEX DEFINITIONS
The Barclays Aggregate Bond Index represents securities that are SEC-registered, taxable, and dollar denominated. The index covers the US investment-grade fixed rate bond market, with index components for government and corporate securities, mortgage pass-through securities, and asset-backed securities.
The Standard & Poor’s 500 Index is a capitalization-weighted index of 500 stocks designed to measure performance of the broad domestic economy through changes in the aggregate market value of 500 stocks representing all major industries. It cannot be invested into directly.
The Russell 2000 Index is an unmanaged index generally representative of the 2,000 smallest companies in the Russell Index, which represents approximately 10% of the total market capitalization of the Russell 3000 Index.
The MSCI Emerging Markets Index is a float-adjusted market capitalization index that consists of indices of approximately 800 stocks and is designed to measure equity market performance in 23 emerging economies: Brazil, Chile, China, Colombia, Czech Republic, Egypt, Greece, Hungary, India, Indonesia, Korea, Malaysia, Mexico, , Peru, Philippines, Poland, Qatar, Russia, South Africa, Taiwan, Thailand, Turkey, and the United Arab Emirates.
The MSCI EAFE (Europe, Australasia, Far East) Index is a free float-adjusted market capitalization index of approximately 900 stocks and is designed to measure equity market performance in 21 developed market countries outside of North America.
The SG Trend Index is a subset of the SG CTA Index and follows traders of trend following methodologies. The SG CTA Index is equal weighted, calculates the daily rate of return for a pool of CTAs selected from the larger managers that are open to new investment.
Swiss Re Global Cat Bond Index tracks the aggregate performance of all catastrophe bonds issued offered under Rule 144A. The index captures bonds denominated in any currency, all rated and unrated cat bonds, outstanding perils, and triggers. The index is not exposed to currency risk from non-USD denominated cat bonds.
The Nasdaq Composite Index is a market capitalization-weighted index of more than 3,000 stocks listed on the Nasdaq stock exchange.
Company News
Market Commentary
Retirement Planning
Tax Planning
Cyber Security
Important Disclosures
Leonard Rickey Investment Advisors, PLLC (“LRIA”), is an SEC registered investment adviser located in the State of Washington. Registration does not imply a certain level of skill or training. For information pertaining to the registration status of LRIA, please contact LRIA or refer to the Investment Adviser Public Disclosure website (www.adviserinfo.sec.gov).
This is provided for general information only and contains information that is not suitable for everyone. As such, nothing herein should be construed as the provision of specific investment advice or recommendations for any individual. To determine which investments may be appropriate for you, consult your financial advisor prior to investing. There is no guarantee that the views and opinions expressed herein will come to pass. This newsletter contains information derived from third party sources. Although we believe these third-party sources to be reliable, we make no representations as to the accuracy or completeness of any information prepared by any unaffiliated third party incorporated herein and take no responsibility therefore.
Any projections, forecasts and estimates, including without limitation any statement using “expect” or “believe” or any variation of either term or a similar term, contained here are forward-looking statements and are based upon certain current assumptions, beliefs and expectations that LRIA considers reasonable or that the applicable third parties have identified as such. Forward-looking statements are necessarily speculative in nature, and it can be expected that some or all of the assumptions or beliefs underlying the forward-looking statements will not materialize or will vary significantly from actual results or outcomes. Some important factors that could cause actual results or outcomes to differ materially from those in any forward-looking statements include, among others, changes in interest rates and general economic conditions in the U.S. and globally, changes in the liquidity available in the market, change and volatility in the value of the U.S. dollar, market volatility and distressed credit markets, and other market, financial or legal uncertainties. Consequently, the inclusion of forward-looking statements herein should not be regarded as a representation by LRIA or any other person or entity of the outcomes or results that will be achieved by following any recommendations contained herein. While the forward-looking statements here reflect estimates, expectations and beliefs, they are not guarantees of future performance or outcomes. LRIA has no obligation to update or otherwise revise any forward-looking statements, including any revisions to reflect changes in economic conditions or other circumstances arising after the date hereof or to reflect the occurrence of events (whether anticipated or unanticipated), even if the underlying assumptions do not come to fruition. Opinions expressed herein are subject to change without notice and do not necessarily take into account the particular investment objectives, financial situations, or particular needs of all investors.
For additional information about LRIA, including fees and services, please contact us for our Form ADV disclosure brochure using our contact information herein. Please read the disclosure brochure carefully before you invest or send money.
2026 1st Quarter Investment Commentary