Jan 14, 2022 2021 4th Quarter Investment Commentary
• The S&P 500 Index gained 11% on the quarter and over 28% on the year, buoyed by strong corporate earnings growth.
• The U.S. economic recovery remained on firmed footing despite inflation, COVID-19 and supply chain disruptions. Going forward, extreme fiscal and monetary support will likely be withdrawn in favor of the private market.
• Bond yields remained negative after inflation and portfolios remained overweight equities relative to investment objectives.
Market Summary
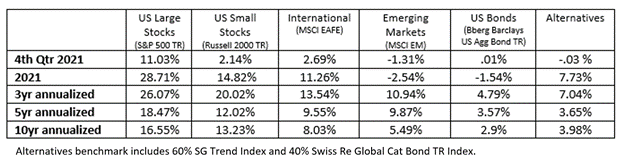
It was another strong quarter and year for the U.S. equity market despite potential headwinds such as increasing inflation, disruption to global supply chains, and the omicron variant of COVID-19. U.S. stocks, as measured by the S&P 500, increased 11% during the quarter and finished the year near all time-highs. An exceptionally strong economic rebound, strong corporate earnings growth, and an accommodative Federal Reserve drove equities higher. The S&P 500 increased 28.7% and hit new all-time highs 70 times during the year (ranking second only to 1995’s 77 (1)). This marked the third consecutive year of double-digit gains on the S&P 500. Over the past three years it advanced at a 26.07% annualized rate, the sixth best 3-year return over the last 82 years (2).
The strong index returns masked the volatility underneath the surface. Many riskier high growth parts of the market that did well in 2020, like SPACs, IPOs and meme stocks, declined significantly in the back half of the year. For the full year, value stocks finally beat growth stocks after four years of underperformance with small-cap value outpacing all other U.S. style boxes. All 11 S&P 500 sectors finished with double-digit % gains in 2021. The 3 worst performing sectors in 2020 (Energy, Real Estate, Financials) were the 3 best performers in 2021.
Non-U.S. developed market stock returns were muted, but they did see double-digit returns for the year. However, emerging markets, weighed down heavily by Covid-19 related closures, global supply chain disruptions, and real estate weakness in China, finished down for the year.
A robust economic backdrop, higher inflation, and expectations of rising interest rates were bad news for bond investors. Yields rose during the year and the U.S. Aggregate Bond Index finished down -1.54%. This marked only the fourth negative returning calendar year since the index’s 1976 inception—and the first since 2013. Treasury inflation-protected bonds and municipal bonds were slightly up on the year. Below is summary of major benchmark returns. (3)
Economic Analysis
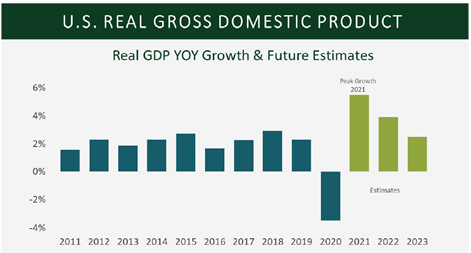
The U.S. economy bounced back from its worst year since the Great Depression in 2020 with one of the best years of growth in nearly 40 years in 2021. Despite a slowdown in GDP growth in the third quarter of 2021, the U.S. economic recovery remained on firm footing. U.S. real GDP was expected to grow over 5% for all of 2021 and consensus economic forecasts were for growth rates to remain higher than recent historical averages but slow in 2022 (see chart) (4). Overall, it appeared that the U.S. was transitioning from early cycle recovery to a mid-cycle phase of economic expansion.
The solid economic recovery was aided by significant monetary stimulus and record amounts of fiscal stimulus. The Federal Reserve cut rates to near-zero levels and bought $120bn of bonds each month since the pandemic began. In addition, U.S. legislation passed in the last two fiscal years added $5.3 trillion to the U.S. economy. This boosted consumer balance sheets and quickly allowed the U.S. economy to recover from the pandemic recession. While the economy continued to move forward, the aftershocks of COVID-19 could still be felt through high inflation, supply chain bottlenecks, and an imbalanced labor market. Job openings were at an all-time high, and people who were either working or looking for work were at levels last seen in the 1970’s (5).
Flush with cash from record stimulus, consumers shifted spending from in-person services into consumer goods, causing supply bottlenecks and price pressures. As measured by the consumer price index (CPI), inflation was up 6.9% for the year ending November 2021, the most significant annual increase since 1982 (6). Inflation was initially contained to supply-constrained industries but started to extend into the broader economy through higher wages and higher rents. In response to the growing threat of inflation and an improved job market, the Federal Reserve signaled it would be shifting from its post-pandemic ultra-easy monetary policies to more restrictive policies in 2022. They announced plans to stop purchasing bonds by March 2022 and projected three rate hikes in 2022. Interest rates were still projected to be low by historical standards. We see these actions more like taking the foot off the accelerator, not hitting the brakes. Positive real interest rates act as a brake on borrowing, spending, and growth while negative real rates act as an accelerator for borrowing, spending, and growth. The Fed’s indicated policy response would likely keep real yields deeply negative throughout 2022.
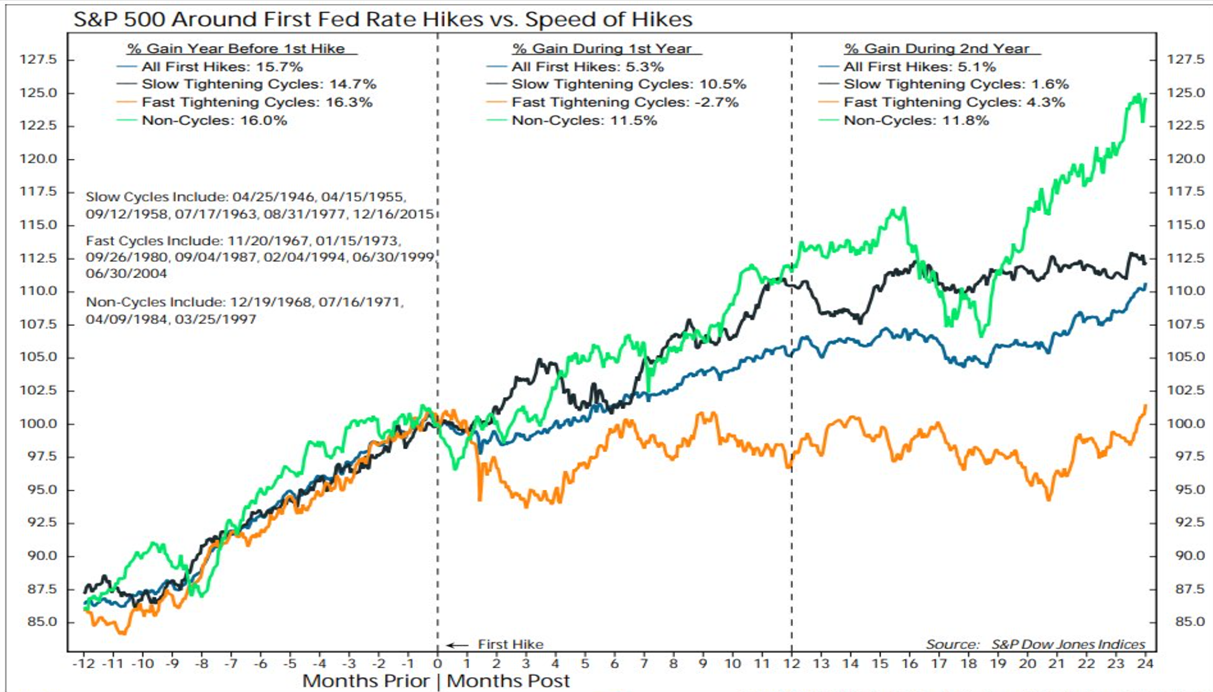
Historically, the start of a Fed tightening cycle hasn’t derailed equity markets. Since 1946, there have been 13 hiking cycles. From the beginning of rate hikes to the next recession, the median time is over three years. Additionally, the last two times the Fed implemented an orderly hiking schedule were December 2015 to December 2018 and June 2004 to August 2007. The S&P 500 gained 23% and 29% during these two periods (7). The chart indicates that the speed of rate hikes matters. Historically, the S&P 500 could digest slow hiking cycles (black line) better than fast hiking cycles (orange line) (8).
There are significant risks to the economy and markets as the economy is handed off from extreme policy support to the private sector. The amount of stimulus put into the economy during the pandemic was unlike anything prior. Fiscal support is likely to drop sharply in 2022, but strong consumer demand may be sufficient to keep the economy growing above trend. Robust household balance sheets, strong corporate capital expenditures and positive trends in productivity looked set to persist into 2022. Nevertheless, removing policy support poses a new challenge for policymakers and a new risk to financial markets in 2022. How smoothly that handoff is executed may determine the course of the recovery. Handoffs can be fumbled, and with inflation running hot and risks around COVID-19 still in play, we see an elevated risk for a policy mistake.
Market Analysis
Over the past decade, one of the best investment strategies has been to buy the fast growing companies, regardless of price. This was particularly true in the post-pandemic bull market. Many investors turned to speculate on high-growth companies with little to no revenue or profit, IPO’s, SPACs and meme stocks like Gamestop. Investors were swinging for home runs, and many of them connected. However, in the back half of 2021, the tides turned and many of the more speculative market areas retreated. For example, two-thirds of U.S. companies that went public in 2021 were trading below their IPO prices (9) by late December.
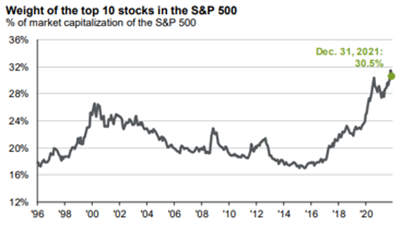
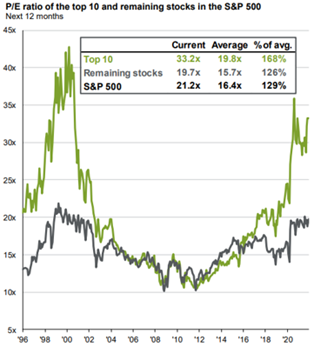
Although we saw some signs of rotation in 2021, market leadership was essentially the same as before the pandemic. The most significant gains were concentrated in large U.S.-based, internet-related businesses. This continuation of pre-pandemic trends means investors should be mindful of the risks in the market. One of the risks is that the S&P 500 has become very concentrated with 28% of the index in Technology and only 10% in Utilities, Real Estate, Energy and Materials combined (10). Furthermore, just 10 stocks accounted for 30% of the index. The valuations of the top 10 stocks were elevated compared to the remaining 490 S&P 500 stocks (11).
In the U.S., this trend created extremely concentrated results: since April, a mere five stocks accounted for more than half of the increase in the S&P 500 Index. In contrast, more than 1,300 stocks that traded on the NASDAQ Index declined 50% or more from their 52-week highs and 80% were down at least 10% (12).
Another risk is that U.S. stock prices relative to earnings and other fundamental measures such as cash flow, sales and book value were at their highest since the late 1990’s. While valuations have little correlation with shorter-term returns, they do have greater predictability over the longer term (13). While overall valuations were high, the stocks underneath the indices were more bimodal. There were fast-growing companies selling at high valuations and slower growth companies selling at valuations near historical levels. In addition, non-U.S. stocks and small/mid-cap U.S. stocks looked more attractively priced.
While overall valuations were high for large U.S. companies, the low yield environment makes stocks relatively more attractive than bonds. For example, the dividend yield on the S&P 500 Index stood at 1.3% as of year-end, while the U.S. Treasury 10-year note was yielding 1.5%. As a result, investors were getting almost as much yield from the stock market as they were from bonds, and unlike a bond, stocks dividends and earnings were expected to grow over time.
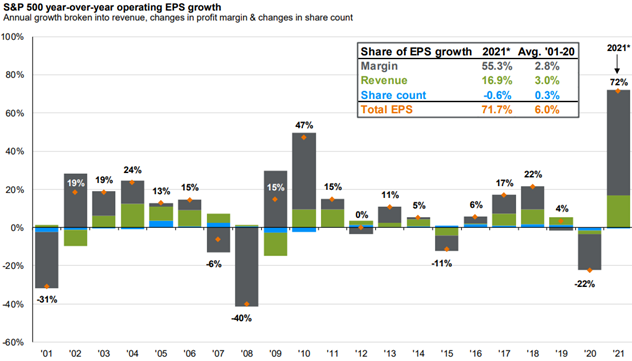
We saw extremely strong earnings growth in 2021. Corporations could pass on higher input costs and increase profit margins to record highs (14). However, we expect earnings growth to slow down, although positive, as the economy moves from early to mid-cycle.
There may be a tendency to think markets reaching a new high is a signal stocks are overvalued or have approached a ceiling. However, the average returns one, three, and five years after a new month-end market high are similar to the average returns over any one-, three-, or five-year period (15). Put another way, reaching a new high doesn’t mean the market will retreat.
Portfolio Positioning
Portfolios remained overweight equities and underweight bonds and cash relative to investors’ strategic weightings. Fading monetary and fiscal policy could pose challenges to equities. However, we still expect economic growth to continue to be positive and equity earnings to continue to grow, although at a slower pace.
Within equities, we continued to tilt toward cyclical value sectors. We reduced emerging markets further and maintained exposure to U.S. mid-cap and small cap stocks where valuations were more reasonable. We added a position to U.S. lower volatility equities that may do better in a slower growth economy. We remained underweight higher growth areas of the market where valuations look expensive.
We continued to favor shorter duration bonds and inflation protected bonds within fixed income that may help protect against higher bond yields and rising inflation expectations. Despite low yields, bonds play a valuable role in portfolios by offsetting pro-risk positions taken in stocks and can be a source of funds to take from in the event of an equity drawdown.
Please reach out to your advisor if you have any questions or concerns.
- S&P Global Research
- Morningstar Direct, 1939-2021
- Morningstar Direct, as of 12/31/2021
- Bloomberg
- Federal Reserve Economic Data as measured by Total Nonfarm Job Openings and Labor Force Participation Rate
- Bureau of Labor Statistics
- James Research
- Ned Davis Research
- Financial Times, Dec. 16, 2021
- Koyfin, as of 12/31/2021
- JPMorgan Guide to the Markets, Dec.31 2021
- Financial Times, Dec. 16, 2021
- Michael Kitces, Shiller CAPE Market Valuation
- JPMorgan, Guide to the Market
- Dimensional Fund Advisors
Company News
Market Commentary
Retirement Planning
Tax Planning
Cyber Security
Important Disclosures
Leonard Rickey Investment Advisors, PLLC (“LRIA”), is an SEC registered investment adviser located in the State of Washington. Registration does not imply a certain level of skill or training. For information pertaining to the registration status of LRIA, please contact LRIA or refer to the Investment Adviser Public Disclosure website (www.adviserinfo.sec.gov).
This is provided for general information only and contains information that is not suitable for everyone. As such, nothing herein should be construed as the provision of specific investment advice or recommendations for any individual. To determine which investments may be appropriate for you, consult your financial advisor prior to investing. There is no guarantee that the views and opinions expressed herein will come to pass. This newsletter contains information derived from third party sources. Although we believe these third-party sources to be reliable, we make no representations as to the accuracy or completeness of any information prepared by any unaffiliated third party incorporated herein and take no responsibility therefore.
Any projections, forecasts and estimates, including without limitation any statement using “expect” or “believe” or any variation of either term or a similar term, contained here are forward-looking statements and are based upon certain current assumptions, beliefs and expectations that LRIA considers reasonable or that the applicable third parties have identified as such. Forward-looking statements are necessarily speculative in nature, and it can be expected that some or all of the assumptions or beliefs underlying the forward-looking statements will not materialize or will vary significantly from actual results or outcomes. Some important factors that could cause actual results or outcomes to differ materially from those in any forward-looking statements include, among others, changes in interest rates and general economic conditions in the U.S. and globally, changes in the liquidity available in the market, change and volatility in the value of the U.S. dollar, market volatility and distressed credit markets, and other market, financial or legal uncertainties. Consequently, the inclusion of forward-looking statements herein should not be regarded as a representation by LRIA or any other person or entity of the outcomes or results that will be achieved by following any recommendations contained herein. While the forward-looking statements here reflect estimates, expectations and beliefs, they are not guarantees of future performance or outcomes. LRIA has no obligation to update or otherwise revise any forward-looking statements, including any revisions to reflect changes in economic conditions or other circumstances arising after the date hereof or to reflect the occurrence of events (whether anticipated or unanticipated), even if the underlying assumptions do not come to fruition. Opinions expressed herein are subject to change without notice and do not necessarily take into account the particular investment objectives, financial situations, or particular needs of all investors.
For additional information about LRIA, including fees and services, please contact us for our Form ADV disclosure brochure using our contact information herein. Please read the disclosure brochure carefully before you invest or send money.
2026 1st Quarter Investment Commentary